In this article, I explain what the most efficient business intelligence automation tools are and how they help companies learn the benefits of actionable insights.
- Key Points & Best Business Intelligence Automation Tools
- 10 Best Business Intelligence Automation Tools
- 1. Microsoft Power BI
- 2. Tableau
- 3. Zoho Analytics
- 4. Supermetrics
- 5. Datapine
- 6. Qlik Sense
- 7. Sisense
- 8. ThoughtSpot
- 9. SAP BusinessObjects
- 10. Looker (Google Cloud)
- How We Choose Best Business Intelligence Automation Tools
- Conclusion
- FAQ
These tools help businesses streamline data collection, data-driven automation, analytics, reporting, facilitate quicker decision making, and help track performance with greater accuracy and help improve performance.
Companies of all sizes, from startups to large corporations, need to choose the right tools to maximize their potential and grow on a data-driven basis.
Key Points & Best Business Intelligence Automation Tools
| Tool | Key Point |
|---|---|
| Microsoft Power BI | Unifies scattered data sources into interactive reports |
| Tableau | Enterprise-grade visual analytics with advanced dashboards |
| Zoho Analytics | Affordable BI solution tailored for small businesses |
| Supermetrics | Integrates over 150 marketing and sales data sources |
| datapine | Self-service dashboards with predictive analytics |
| Qlik Sense | Associative data model enabling deeper insights |
| Sisense | Embedded analytics for apps and workflows |
| ThoughtSpot | Search-driven analytics with AI-powered queries |
| SAP BusinessObjects | Enterprise reporting with strong governance features |
| Looker (Google Cloud) | Modern BI with data modeling via LookML |
10 Best Business Intelligence Automation Tools
1. Microsoft Power BI
Microsoft Power BI is a top Business Intelligence and Analytics platform. It works with every part of Microsoft (Teams, SharePoint, Azure, and Excel), making it easy to work with and collaborate in real time.
It has fully customizable dashboards that pull in real time data from over a hundred sources, automated data updates, and even AI-based natural language queries.
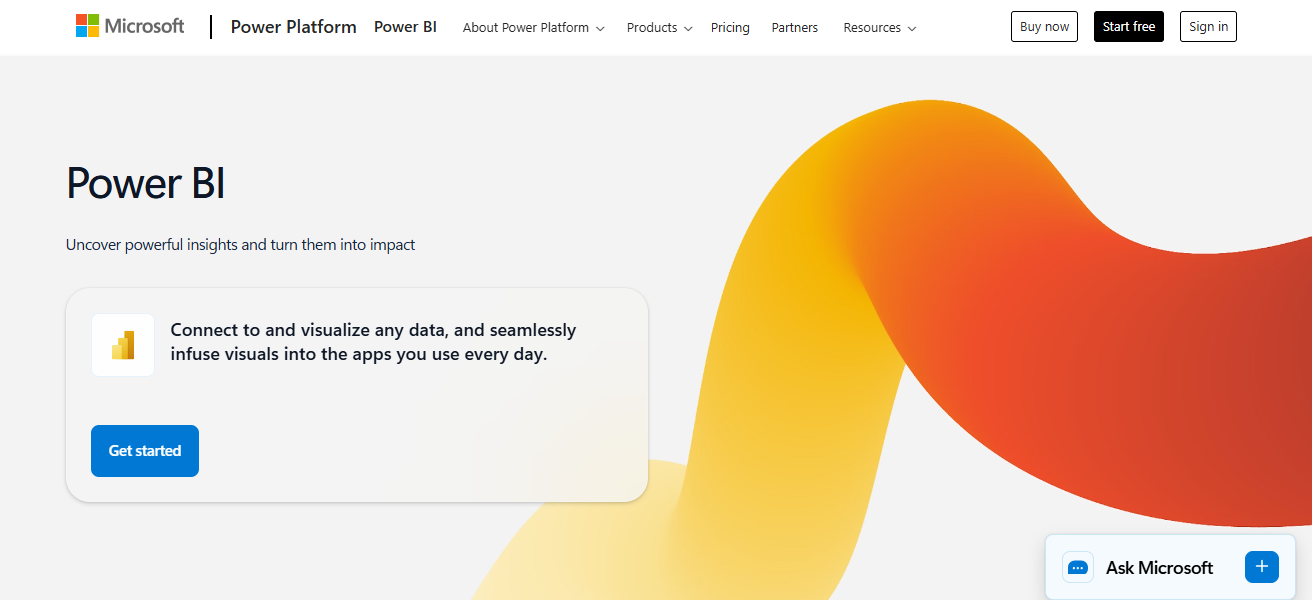
Power BI has over twenty percent market share and is used by over 100,000 users globally Power BI is certainly affordable, starting at ten dollars a month, so it is used by users of from small medium businesses to large enterprises.
Features Microsoft Power BI
Data Connectivity – Provides linking with over 100 data sources such excel, sql, azure, and other cloud applications for consolidated reporting.
AI Insights – Embedded artificial intelligence leverages recognition and analyzes natural patterns to automatically detect trends.
Interactive Dashboards – Custom dashboards that are visually and aurally engaging, modify themselves automatically and permit multiple viewings.
Collaboration & Sharing – Microsoft Teams and Microsoft SharePoint integration for report distributions and team collaboration.
| Pros | Cons |
|---|---|
| Affordable pricing with strong ROI. | Can be overwhelming for new users. |
| Seamless integration with Microsoft 365, Azure & Excel. | Large datasets sometimes lag without Premium. |
| 100+ built‑in connectors and AI insights. | Some advanced automation requires Premium license. |
| Excellent sharing, collaboration & governance. | Limited advanced visual customizations vs Tableau. |
2. Tableau
Tableau, now integrated with Salesforce, is a leader in interactive data storytelling and advanced data visualization.
It allows teams to see data trends, outliers, and performance metrics with analytics that you can see and manipulate in a visual way.
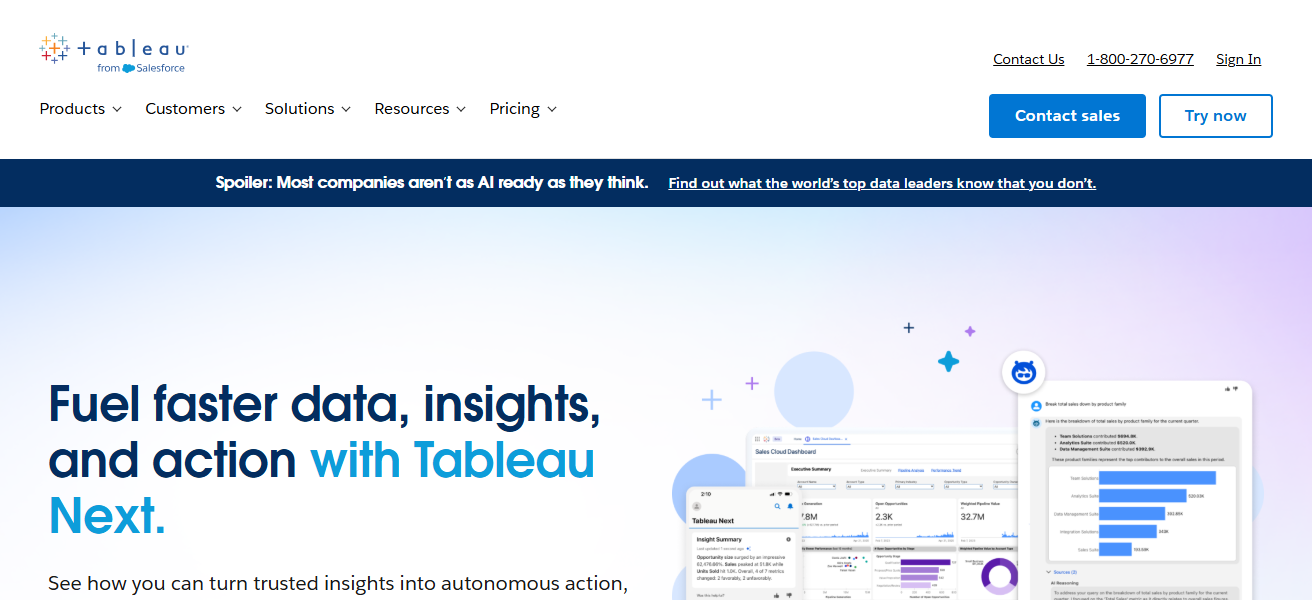
It works with 200+ cloud, on-prem, and multi-cloud sources. The 2025 version includes advanced predictive analytics and improved spatial data for real-time collaborations.
Analysts and data storytellers love it. For ~$70/user/month it is espensive, but global enterprise stills prefer it for advanced visual analytics.
Features Tableau
Advanced Visualizations – Beautifully rendered, visually appealing data portrayals such as graphical charts, or digitally rendered maps through dashboards convey sophisticated narratives.
Data Blending – It is possible to integrate data from various sources with little to no technical expertise.
Live & Extract Connections – It can seamlessly connect with and function from live data sources or data extracts for quicker data analyses.
Drag-and-Drop Interface – Configuration of an analytics framework can be done with little to no coding knowledge.
| Pros | Cons |
|---|---|
| Best‑in‑class interactive visualizations. | Higher price per user. |
| Drag‑and‑drop analytics; strong community. | Steep learning curve for beginners. |
| Works with many data sources. | Server deployment is complex. |
| Great for data storytelling. | Requires training for advanced features. |
3. Zoho Analytics
Out of many AI-powered automation tools, one of the cheapest options is Zoho Analytics, which can connect to and analyze over 500 applications seamlessly.
Because of Zia, which functions as an AI query assistant, the program is capable of understanding simple questions and rapidly returning relevant visual and textual output.
Zoho Analytics is able to complete automated CRM, finance, and marketing data reports 50% faster.
Zoho has an extensive free tier and paid tier starting at just $24/month, which is great for small and medium-sized businesses needing to monitor success, optimize marketing funnels, and analyze results in real time without complex technical work.
Features Zoho Analytics
AI Assistant (Zia) – Natural language queries can be posed to Zia by users to, for example, retrieve ‘top sales regions.’
Smart Data Blending – Different datasets can be seamlessly integrated for consolidated reporting.
Automated Reporting – Manual labor is eliminated through scheduling of report delivery and data refresh.
Dashboard Customization – Rapid data visualization can be achieved through easily alterable dashboards and prompt data integration with data widgets.
| Pros | Cons |
|---|---|
| Very cost‑effective; free tier available. | Fewer advanced analytics than enterprise tools. |
| AI assistant (Zia) for natural language queries. | Visualizations are basic vs Tableau/Power BI. |
| Easy data blending across apps. | Limited ecosystem & third‑party extensions. |
| Quick setup with SMB focus. | Performance can lag on high‑volume data. |
4. Supermetrics
Supermetrics’ focus is on collecting data from Google Analytics, Facebook, CRMs, etc., and automatically pulling that data into dashboards or spreadsheets.
Marketing analytics, data extraction, and automation is where the Supermetric automates scheduled data refreshes, custom data transformations, and the templates that are built for common reports such as PPC performance or budget pacing.
Supermetrics automates the reporting processes that are repetitive so that you know your dashboards and automated reports are always current and there is no need for manual work.
Features Supermetrics
Data Extraction Automation – Data is obtained from resources such as Google Analytics and Facebook Ads.
Scheduled Refreshes – Updates reports automatically based on a schedule.
Pre-Built Templates – Prepared dashboards for routine marketing reports so time does not have to be spent setting it up.
Connector-Rich – Includes a lot of data sources commonly used in marketing and sales.
| Pros | Cons |
|---|---|
| Excellent for marketing & ad data automation. | Not a full standalone BI dashboard tool. |
| Strong scheduled refresh & connectors to ad platforms. | Pricing increases with volume & connectors. |
| No coding required. | Needs external dashboards (Sheets, Data Studio, Power BI). |
| Fast setup for reporting automation. | Limited advanced analytics capabilities. |
5. Datapine
Datapine provides a model that is a bit different. datapine is a web based BI platform that helps businesses make better decisions by transforming data into actionable insights.
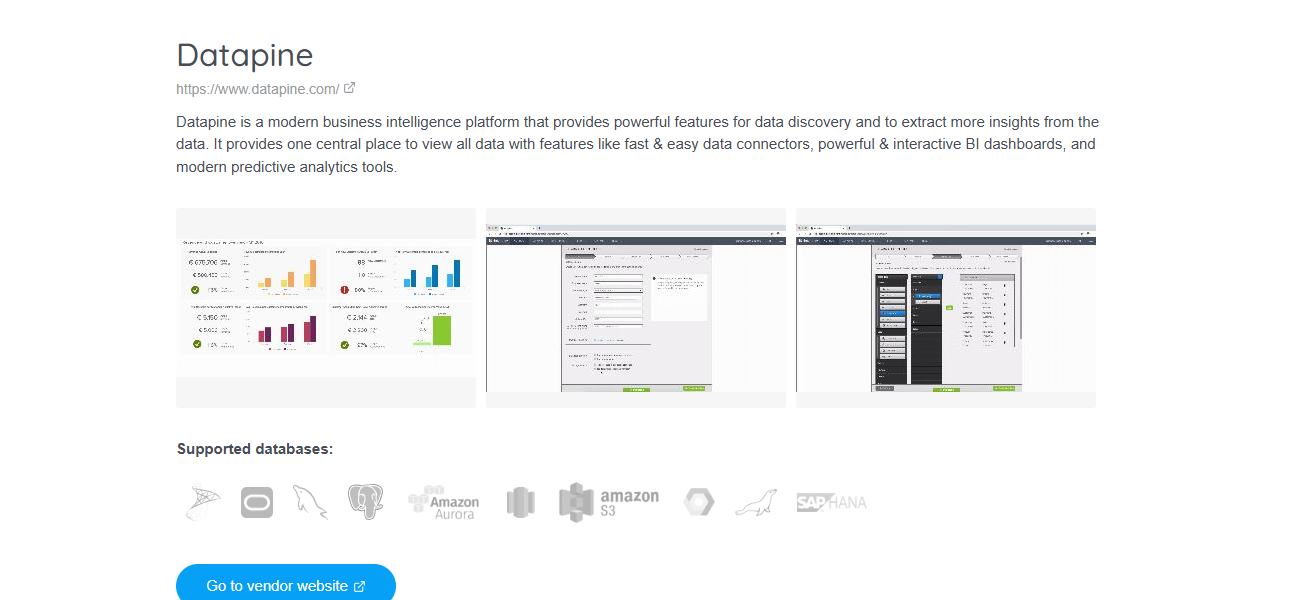
Datapine helps businesses visualize KPI dashboards and automate reporting workflows. datapine’s whole suite consists of dashboards and smart alerts that help businesses make better decisions.
They also help automate decision reporting workflows. Businesses use datapine to gain insights and improve their decision making speed and acuracy. You do not need to have technical skills to use datapine.
Features Datapine
Drag-and-Drop Insights – Create dashboards without any coding.
Predictive Analytics – Forecasting based on historical data.
Smart Alerts – Notifications are received if certain metrics are breached.
KPI Tracking – Direct and quick access to KPIs related to business performance
| Pros | Cons |
|---|---|
| Intuitive drag‑and‑drop dashboard builder. | Fewer native integrations than big BI vendors. |
| Smart alerts & predictive capabilities. | Customization is limited vs enterprise tools. |
| Quick KPI tracking & reports. | Not ideal for complex analytics needs. |
| Easy onboarding for business users. | Advanced enterprise features cost extra. |
6. Qlik Sense
One of the unique aspects of Qlik Sense is that it features an associative analytics engine that allows users to examine data and relationships without having to preset query paths.
It allows users to conduct AI driven predictive analysis and empowers its users to delve into complex questions through customizable visualizations.
Because of the flexibility of Qlik’s cloud or on-premises deployment and the added features of strong data security and mobile BI
Qlik is a great option for large organizations that need deep analytical exploration that is governed and distributed across its various business units.
Features Qlik Sense
Associative Engine – Data relationships can be explored without any preconfigured queries.
AI-Powered Recommendations – Gives smart suggestions for the next steps in the analysis.
Governed Self-Service – Balanced self-service for users with control of the data centrally.
Mobile Support – Dashboards are fully functional for phones and tablets.
| Pros | Cons |
|---|---|
| Associative engine enables flexible exploration. | Licenses and pricing can be confusing. |
| Strong embedded analytics & security. | Requires learning for best utilization. |
| Good governance and scalable architecture. | Higher cost for enterprise scale. |
| AI‑driven insights and mobile support. | Interface feels complex to beginners. |
7. Sisense
Sisense integrates analytic tools with data embedding , processing, and operational capabilities, and allows organizations to embed
BI into internal systems and public-facing tools. Sisense accelerates processing of large data sets with its unique “In-Chip” architecture.
Sisense also integrates automated analytic insights with self-service, drag-and-drop dashboarding capabilities.
Sisense is most adept at serving digital and SaaS platforms that seek data operationalization and customization of analytics with minimal engineering effort.
This is also a common choice by enterprises that require analytics to be embedded into strategic business workflows.
Features Sisense
In-Chip Processing – Faster analysis of large data sets with optimized hardware.
Embedded BI – Analytics can be added to your internal applications as well as customer-facing products.
API-Driven Customization – Offers developer APIs for customized analytics experiences.4. Unified Data Models – Bringing different data sets together into one analytical unit.
| Pros | Cons |
|---|---|
| Excellent embedded analytics for apps/products. | Interface can feel less modern. |
| “In‑Chip” processing speeds large queries. | Admin setup and maintenance are heavier. |
| Strong customization with APIs. | Higher pricing for enterprise packages. |
| Good for SaaS and digital platforms. | Requires technical resources. |
8. ThoughtSpot
ThoughtSpot’s innovation in Business Intelligence (“BI”) revolves around its unique Google-like search bar for analytics that allows users to ask questions such as
What are the top-selling products last quarter” and receive instant and instantly rendered visual analytics. Natural language analytics, AI-automated SpotIQ, and real-time processing for large datasets comprise the analytics engine.
While self-service analytics target non-technical end users, the analytics engine can also be embedded in end-user applications.
With a modern cloud tech stack and solid user experience, ThoughtSpot is an excellent option for organizations that aim to democratize AI-driven Business Intelligence.
Features ThoughtSpot
Search-Driven Analytics – Use basic search terminology to pose questions and receive immediate graphical representations of data.
AI Insights (SpotIQ) – Insights are automatically discovered through pattern recognition.
Cloud-Native Architecture – Designed to support large scale and distributed organisations.
Embedded Analytics – Integrate business intelligence functionalities into other software or applications.
| Pros | Cons |
|---|---|
| Search‑based analytics for non‑technical users. | More costly at enterprise scale. |
| AI‑powered insights with SpotIQ automation. | Smaller visualization library. |
| Fast real‑time performance at scale. | Needs well‑modeled data for best results. |
| Cloud‑native and scalable. | Steep learning for advanced modeling. |
9. SAP BusinessObjects
SAP BusinessObjects is an enterprise grade Business Intelligence application with strong integration to SAP ERP and HANA products with sophisticated reporting
Dashboards, and governed analytics across large organizations. It offers role access, scheduled report automation, and detailed ad-hoc queries.
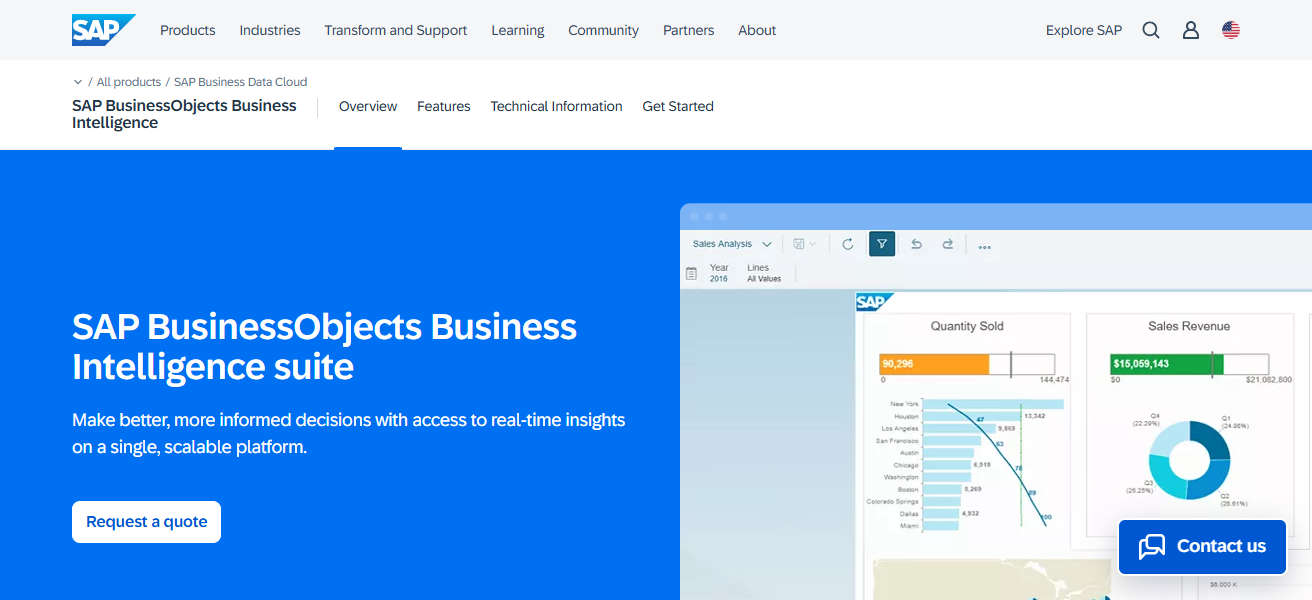
It is built to scale with organizations from hundreds to tens of thousands of users. BusinessObjects is a dominantly used application in heavily regulated sectors
As it offers secure and centralized document distribution as well as complex financial and operational reporting.
Features SAP BusinessObjects
Enterprise Reporting – Generate comprehensive, scheduled reports on a routine basis from different business units.
Integration with SAP ERP/HANA – Extensive integration with primary business systems.
Governance and Security – Comprehensive control systems, access and regulatory compliance.
Ad-Hoc Querying – Perform complex data queries without needing IT assistance.
| Pros | Cons |
|---|---|
| Deep integration with SAP ERP & HANA. | Complex setup & maintenance. |
| Robust governance and security. | High total cost of ownership. |
| Automated reporting for large enterprises. | Less intuitive for casual users. |
| Scales to tens of thousands of users. | UI feels dated vs modern tools. |
10. Looker (Google Cloud)
Looker (Google Cloud) incorporates a semantic modeling layer (LookML) to familiarize metrics and streamline analytics across teams. It is superior in cloud-native governed BI with deep, real-time integration to BigQuery and other cloud data warehouses.
Looker provides excellent cloud-based and governed BI with instantaneous insights and deep integration with BigQuery and other cloud data warehouses.
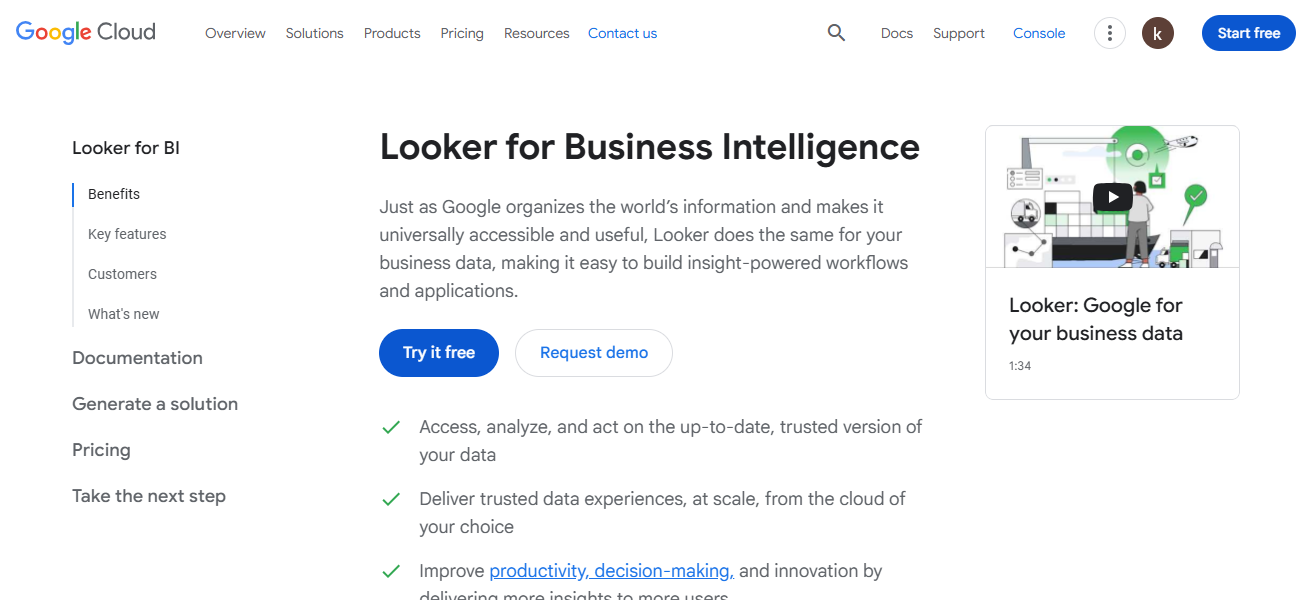
Looker provides embedded analytics and scalable data governance with the ability to customize data models.
Although pricing is enterprise-oriented, Looker is best in environments where teams require a high degree of uniformity in their definitions and metrics.
Features Looker (Google Cloud)
Semantic Modeling (LookML) – Aligns definitions and business metrics to create consistency across teams.
Cloud-Native Insights – Offers instantaneous reports deriving from cloud data reservoirs.
Embedded and Shared Analytics – Seamlessly incorporate analytics capabilities into various applications and processes.
Scalable Governance – Consolidated control of data logic and access across different units within an organisation
| Pros | Cons |
|---|---|
| Strong semantic layer (LookML) for metric consistency. | Requires modeling skills to maximize. |
| Real‑time cloud analytics & BigQuery integration. | Higher entry cost for smaller teams. |
| Excellent embedded & governed BI. | Cloud‑centric; less ideal for on‑premises. |
| Scalable with strong developer support. | Training needed for advanced customization. |
How We Choose Best Business Intelligence Automation Tools
Data Integration & Connectivity – Having the capacity to connect to a variety of data inputs (via databases, cloud applications, and APIs) with facility.
Automation Capabilities – Having the ability to automate the data refresh process, generate reports, and set alerts as a means of minimizing manual labor.
Ease of Use – Users have the benefit of serving themselves through the use of self-service, such as dashboards, and drag and drop applications, which, through a straight-forward minimization of the ease of use, eliminate the need to train users.
Analytics & AI Features – Insights, analytics, and forecasting of data as well as the use of AI in advanced features, such as through plain language.
Scalability & Performance – Sustains performance and efficiency in relation to data and users.
Visualization Quality – Featuring the capacity to display data through interactive, and modified dashboards, reports, and data.
Security & Governance – Tiered security of data, data access based on role, as well as, security protective compliance.
Pricing & Value for Money – Reasonable pricing in relation to the features, the users in the business, as well as, the business size.
Deployment Options – Flexibility with respect to the model of deployment, either on the premises (on-prem) or in a cloud (cloud) environment, or a combination of the two (hybrid).
Conclusion
To conclude, top business intelligence automation systems enable companies to analyze information effectively, automate their reporting processes, and gain insights in real time.
Organizations are able to make better and quicker decisions and improve their productivity and competitiveness in a data-driven economy by acquiring the appropriate BI tools.
Choosing a business intelligence automation software that aligns with your organization’s target goals ensures the tool’s long-term scalability and measurable business success.
FAQ
They automate data collection, analysis, and reporting to provide real-time business insights.
They reduce manual work, improve accuracy, and speed up decision-making.
Startups, SMBs, and enterprises that rely on data-driven decisions.
Yes, most modern BI tools offer real-time or near real-time data updates.
Many tools offer drag-and-drop dashboards and AI-assisted analytics.