In this article, I will discuss the Best Tools for Regime Detection in Financial Markets. Detecting market regimes is crucial for traders and investors to adapt strategies, manage risks, and optimize portfolio performance.
- Key Points & Best Tools For Regime Detection in Financial Markets
- 10 Best Tools for Regime Detection in Financial Markets
- 1. Hidden Markov Models (HMMs)
- 2. Gaussian Mixture Models (GMMs)
- 3. Kalman Filters
- 4. Bayesian Change Point Detection
- 5. Principal Component Analysis (PCA)
- 6. Machine Learning Classifiers (SVM, Random Forests)
- 7. K-Means Clustering
- 8. Deep Learning (LSTMs, RNNs)
- 9. LuxAlgo AI Tools
- 10. Volatility Regime Models (GARCH, EGARCH)
- Why is Regime Detection Important for Trading?
- What Features Should traders look for in Regime Detection Software?
- Cocnlsuion
- FAQ
From traditional models like HMMs and GARCH to modern AI-driven solutions and deep learning tools, these platforms provide insights into market trends, volatility, and structural shifts, helping traders make informed decisions.
Key Points & Best Tools For Regime Detection in Financial Markets
Hidden Markov Models (HMMs) Captures probabilistic transitions between market regimes, modeling hidden states underlying observed financial data.
Gaussian Mixture Models (GMMs) Clusters market data into regimes using probability distributions, effective for volatility and trend segmentation.
Kalman Filters Dynamic state-space models tracking regime shifts in noisy financial time series with adaptive estimation.
Bayesian Change Point Detection Identifies structural breaks in financial series, signaling regime shifts with probabilistic confidence measures.
Principal Component Analysis (PCA) Reduces dimensionality, highlighting dominant factors driving regime changes across correlated financial instruments.
Machine Learning Classifiers (SVM, Random Forests) Supervised learning models classify regimes using labeled historical data, improving predictive trading strategies.
Deep Learning (LSTMs, RNNs) Captures temporal dependencies in financial time series, detecting nonlinear regime shifts with high accuracy.
LuxAlgo AI Tools Provides AI-powered regime detection, backtesting strategies, and actionable trading signals for diverse market conditions.
Volatility Regime Models (GARCH, EGARCH) Models conditional volatility patterns, distinguishing calm, turbulent, or crisis regimes in financial markets.
10 Best Tools for Regime Detection in Financial Markets
1. Hidden Markov Models (HMMs)
The most common regime detection tool in finance, the Hidden Markov Model (HMM), regards market regimes as discrete hidden states such as “bull”, ”bear” or high-volatility periods.
Similar results are obtained with HMMs but today Gaussian and Bayesian HMMs are the ones in use, where you can apply state selections dynamically which represents a better adaptability of each model per asset.
HMM-based approaches have been reported to produce Sharpe ratio greater than 2.0 with lower drawdowns .
Platforms such as LuxAlgo, for example, now take routine price and volatility data and turn them into real-time probabilities of being within a given regime allowing traders to actually mitigate risk on the fly or identify regime shifts much earlier than traditional indicators.
| Feature | Description |
|---|---|
| Probabilistic Modeling | Captures hidden states driving observed financial data. |
| Transition Dynamics | Models regime shifts through state transition probabilities. |
| Flexibility | Handles nonlinear and stochastic market behaviors. |
| Sequential Data | Well-suited for time series analysis. |
| Risk Management | Identifies calm vs. turbulent regimes for portfolio adjustment. |
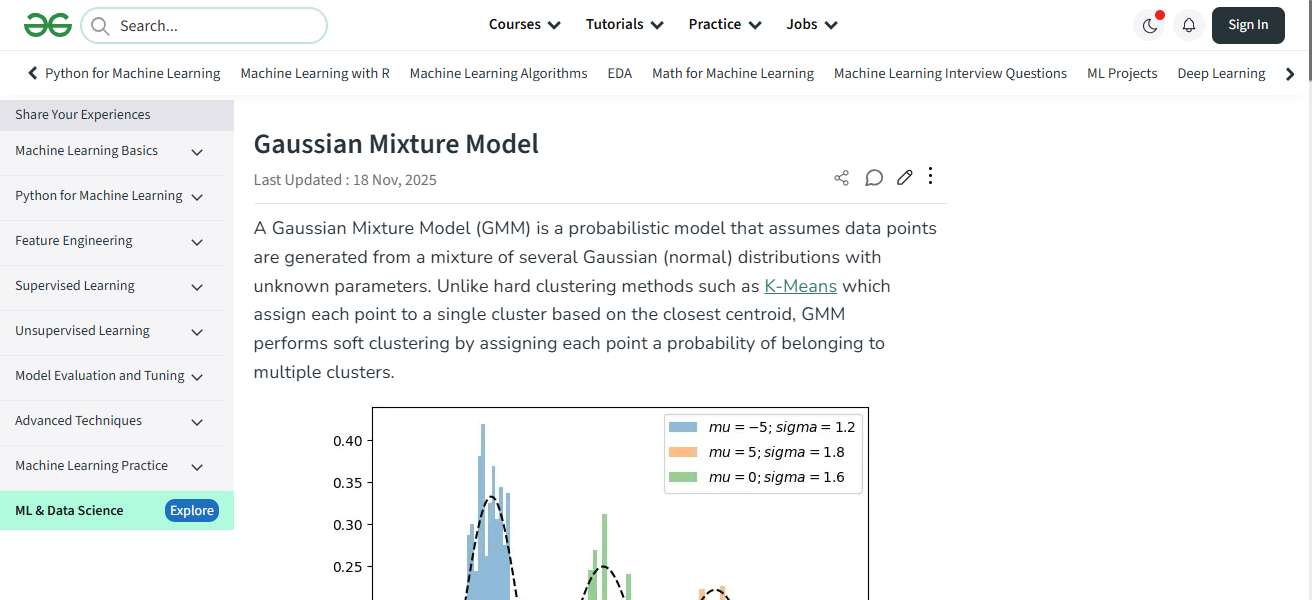
2. Gaussian Mixture Models (GMMs)
Gaussian Mixture Models (GMMs) identify market regimes through clustering of return distributions into several Gaussian components, allowing researchers to capture non-linear and multi-modal behavior in returns.
In contrast to HMMs, GMMs assume that observations are independent of one another and thus tend to be computationally simple and run faster on large data.
More recently, hybrid approaches that amalgamate GMMs and HMMs have been developed to retain robustness in the presence of regime-switching uncertainty
In 2025–2026 research, GMM-based latent models arise increasingly in the crypto and equity markets to identify volatility clusters and structural breaks among regimes, when mode transitions are more abrupt or even less sequential.
| Feature | Description |
|---|---|
| Clustering | Groups market data into regimes using Gaussian distributions. |
| Flexibility | Models multimodal distributions effectively. |
| Volatility Detection | Distinguishes high vs. low volatility regimes. |
| Unsupervised Learning | No need for labeled data. |
| Adaptability | Works across diverse asset classes. |
3. Kalman Filters
Applications of Kalman Filters for Smoothing/Filtering Dynamical Systems in Financial SettingKalman Filters have been widely utilized for real-time regime estimation in financial markets
With specific applications evident in tracking dynamic systems such as interest rates or asset prices. They update estimates recursively as new observations are made, lending them to adaptive trading strategies.

Although this approach gained traction, more contemporary developments build on the idea by combining Kalman filters with switching models and other machine learning to allow for smoother transitions over time in regimes instead of abrupt shifts.
They are commonly used as hybrid state-space models in modern quant trading, where they are integrated with HMMs to enhance forecasting performance and minimize noise in high frequency data settings.
| Feature | Description |
|---|---|
| State-Space Modeling | Tracks hidden states in noisy financial data. |
| Real-Time Updating | Adjusts estimates dynamically with new observations. |
| Noise Handling | Effective in uncertain environments. |
| Forecasting | Provides short-term regime predictions. |
| Adaptability | Useful for dynamic portfolio strategies. |
4. Bayesian Change Point Detection
Bayesian Change Point Detection estimates the probability of regime shifts at each time step in a time series and accordingly identifies potential structural breaks.
Unlike clustering methods, it explicitly detects when a regime change happens, which makes it relevant for crisis or macroeconomic transition periods.
Recent advancements include online Bayesian updating, enabling real-time detection of market jolts like volatility spikes.
This technique is more and more used in the high-frequency trading and cryptocurrency realms starting from 2025–2026.
For example, abrupt regime changes can be identified based on news articles or liquidity shocks, as well as imbalances of buying/selling orders placed by algorithms (millions) versus market orders
| Feature | Description |
|---|---|
| Structural Breaks | Identifies sudden regime shifts in financial series. |
| Probabilistic Confidence | Quantifies likelihood of regime change. |
| Flexibility | Works with multiple time horizons. |
| Risk Alerts | Signals potential crises or transitions. |
| Transparency | Provides interpretable regime change evidence. |
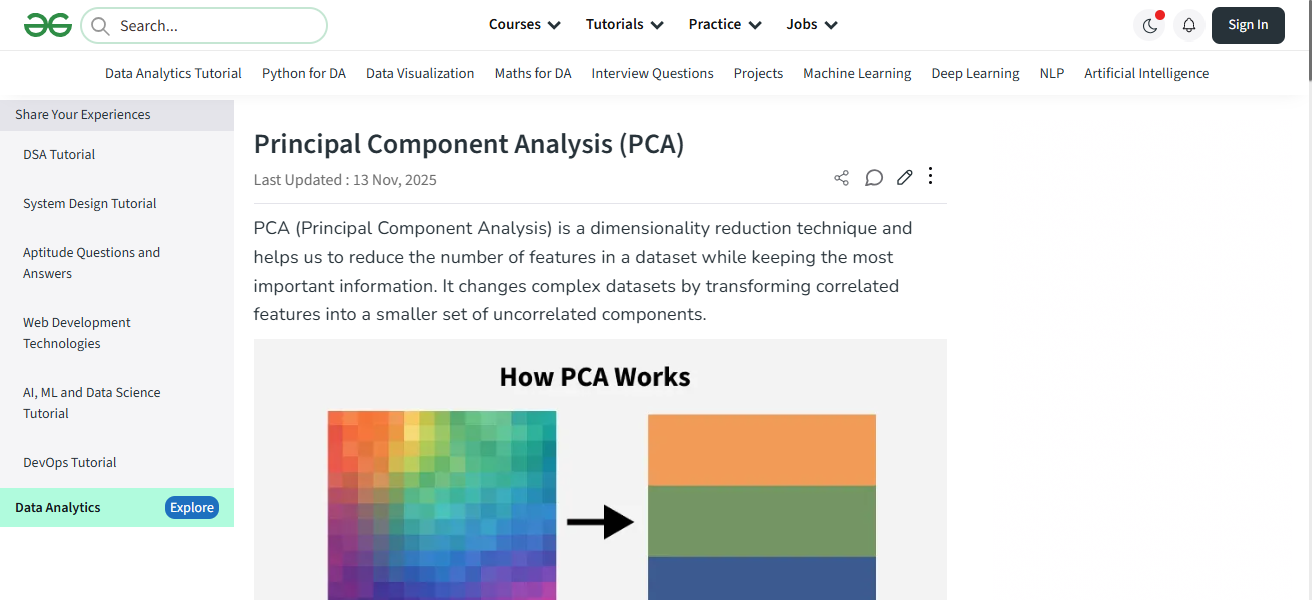
5. Principal Component Analysis (PCA)
Principal Component Analysis (PCA) transforms high-dimensional financial data into a small number of factors that account for the majority of the variance in the market, making this concept ideal to apply in regime detection across many assets.
Irrespective of computational efficiency, most forms of macro-based time series data are in a state that cannot be directly used as input without pre-processing.
Recently, PCA has been paired with HMMs in tandem to combine regimes from diverse variables and improve the classification accuracy of hidden states for regime detection across 12 cross-asset classes
The PCA-powered models succeeded in identifying systemic risk regimes by extracting commonalities within stocks, bonds and other commodities between January 2010 to when the data ended in 2025.
This makes it particularly useful in the area of portfolio management where regime changes are frequently due to shifts in underlying factor structure.
| Feature | Description |
|---|---|
| Dimensionality Reduction | Simplifies complex market data. |
| Factor Analysis | Highlights dominant drivers of regime changes. |
| Noise Filtering | Removes irrelevant variations. |
| Visualization | Helps interpret regime shifts graphically. |
| Cross-Market Insight | Detects correlations across instruments. |
6. Machine Learning Classifiers (SVM, Random Forests)
Supervised machine learning classifiers including Support Vector Machines (SVM) and Random Forests classify market regimes from labeled or semi-supervised data.
These models are particularly good at capturing nonlinear dependencies among indicators like volatility, momentum and macroeconomic performance.
Some of the recent developments have been ensemble learning and feature engineering with alternative data (news sentiment, order flow).

In these hedge funds, we see a plethora of Random Forest-based regime classifiers (with prediction windows extending up to next 1 week)
As they are interpretable and robust for regime identification tasks; They outperform traditional statistical models in predicting short-term regime transitions.
| Feature | Description |
|---|---|
| Supervised Learning | Uses labeled data for regime classification. |
| Accuracy | Strong predictive performance. |
| Flexibility | Handles nonlinear relationships. |
| Feature Importance | Identifies key regime drivers. |
| Scalability | Works with large datasets. |
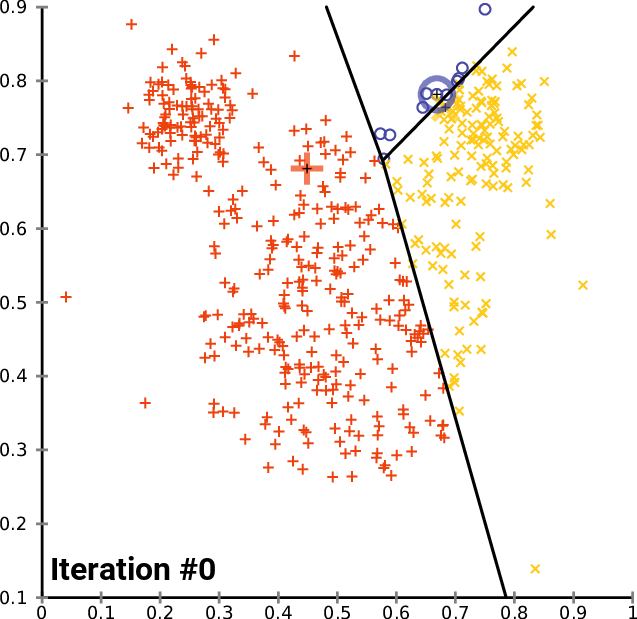
7. K-Means Clustering
K-means clustering is a simple but effective unsupervised approach which clusters market data into different regimes based on the similarity of returns, volatility, or technical indicators.
It is computationally economical, and very useful for exploratory analysis. Recent studies, however, reveal another limitation of this approach—the difficulty in capturing temporal dependencies and the tendency for models based on it to yield broad regimes such as bull or bear markets.
Fortunately, recent advances have made it possible to refine K-Means based on time periods using models like Hidden Markov Models (HMMs) and deep learning techniques.
| Feature | Description |
|---|---|
| Unsupervised Learning | Groups data into clusters without labels. |
| Simplicity | Easy to implement and interpret. |
| Market Segmentation | Identifies distinct regimes. |
| Efficiency | Fast computation for large datasets. |
| Adaptability | Works across multiple asset classes. |
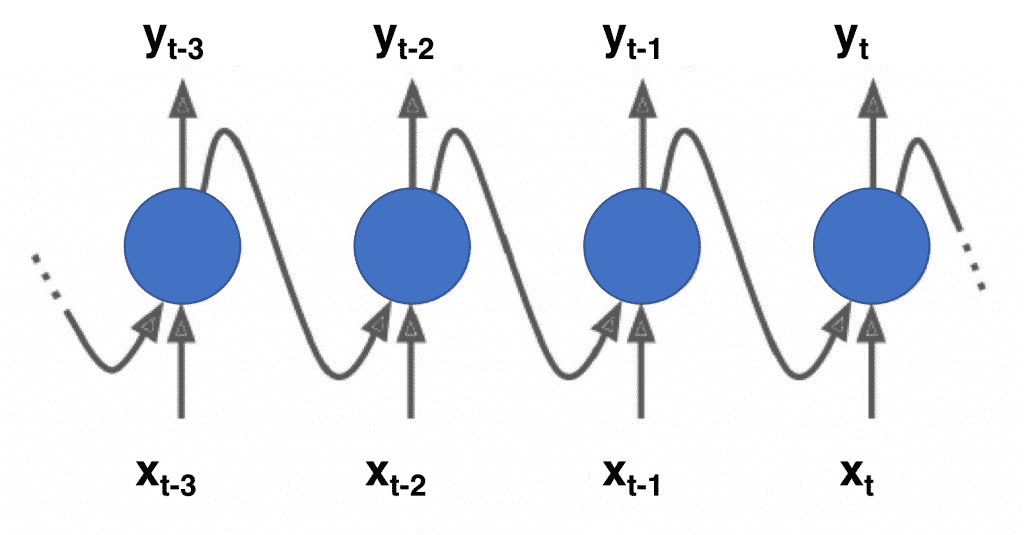
8. Deep Learning (LSTMs, RNNs)
Long Short-Term Memory (LSTM) and Recurrent Neural Networks (RNN) models in Deep Learning are also being used for regime detections because they come with the ability to capture temporal dependencies along with long-term patterns.
Recent advances include transformer-based and hybrid architectures that combine regimes classification with prediction tasks.
Research published in 2025 found the best algorithms consistently delivered predictive accuracy equivalent to R² upwards of 0.89 and strong risk-adjusted returns.
These models tend to work well for identifying complex, non-linear regime changes in highly volatile regimes such as crypto and derivatives trading.
| Feature | Description |
|---|---|
| Temporal Modeling | Captures sequential dependencies in time series. |
| Nonlinear Detection | Identifies complex regime shifts. |
| Scalability | Handles massive datasets. |
| Forecasting | Strong predictive power for future regimes. |
| Adaptability | Learns evolving market dynamics. |
9. LuxAlgo AI Tools
LuxAlgo’s AI-powered algorithms being a new class of regime detection systems for retail, bringing HMM (Hidden Markov Model)-like probabilistic models directly into TradingView.
Real time price and volatility inputs are used to classify markets into multiple regimes (trending, ranging, volatile).
One of the major innovations is the visual display of regime probabilities (0–100%), giving traders a scientific way to trade without coding.
However, it’s 2026, and these tools are closing the gap between institutional quant models and your retail trader with automated regime-aware trading insights.
| Feature | Description |
|---|---|
| AI-Powered | Automated regime detection with advanced algorithms. |
| Backtesting | Tests strategies across historical regimes. |
| Trading Signals | Provides actionable buy/sell alerts. |
| User-Friendly | Designed for traders with minimal coding. |
| Versatility | Works across stocks, forex, crypto. |
10. Volatility Regime Models (GARCH, EGARCH)
Models based on volatility, such as GARCH and EGARCH, center upon the persistence and clustering of market conditions—two important signals of regime-switching.
These are widely used models in risk management and derivatives pricing. More recent approaches to GARCH modeling have begun utilizing hybrid frameworks that combine GARCH models with regime-switching designs in the hopes of better capturing extreme events and tail risks.
Nonetheless, recent studies have shown that even though GARCH does very well in terms of capturing the phenomenon of clustered volatility, it fails to capture the regime persistence and therefore a class of combined model has emerged combining HMM and GARCH-like models were not quite successful.
| Feature | Description |
|---|---|
| Volatility Modeling | Captures conditional variance in financial series. |
| Regime Differentiation | Distinguishes calm vs. turbulent markets. |
| Flexibility | Handles asymmetric volatility effects. |
| Risk Management | Useful for hedging strategies. |
| Forecasting | Predicts future volatility regimes. |
Why is Regime Detection Important for Trading?
Enhances risk management: Recognizes high-volatility or unpredictable phases, enabling optimal position sizing and capital safeguarding.
Bikeshed every approach into the right regime: Avoids mistakes of applying the wrong strategy into the wrong regime, reducing losses and improving performance
Portfolio optimization: Modifies macro exposure via strategic allocation in various regime states including growth, recession, inflation phases.
Minimizes drawdowns: It sniffs out bad trading conditions in advance, minimizing significant losses.
What Features Should traders look for in Regime Detection Software?
Raw data on regime shifts: Identification of occupancy location on environment state space.
Customizable indicators: Enables the addition of volatility, momentum, macro and alternative data.
Visualization of the probability signals: Makes clear the regimes (e.g., trending, ranging and volatile) that are likely to happen.
Backtest & simulation: Tests strategies on historical regime changes for performance validation.
Automated alerts: Tells traders when regimes shift or if they are in a high-risk condition.
Portfolio integration: Assist in dynamic allocation adjustments based on identified regimes
Simplicity: Makes complex models easy to understand for retail and professional traders.
Open API or data export: Allows подключения к trading platforms или Python custom strategy.
Accuracy metrics & reporting: Displays performance, confidence levels and error rates of the models.
Cocnlsuion
To wrap up, the Best Tools for Regime Detection in Financial Markets enable traders and investors to adapt to dynamic market circumstances.
These solutions range from statistical models such as HMMs and GARCH to advanced Artificial Intelligence (AI) and deep learning assistance, increasing the adaptability of strategies, risk management capability, and improved decision-making.
Using the correct regime detection tool can enhance returns, lower drawdowns, and give an edge in a changing market.
FAQ
Yes, GitHub frameworks like “Hidden Regime” provide end-to-end pipelines for regime detection, including data processing, modeling, and backtesting for quantitative research.
Common limitations include overfitting, delayed detection, and instability across different market conditions. Models may detect effects of regime changes rather than predict them in advance.
Yes, models like LSTMs and RNNs capture time dependencies and complex patterns in financial data, making them effective for detecting evolving and non-linear regime transitions.
GMMs cluster financial data into multiple distributions, helping detect regimes based on statistical patterns. They are useful when market behavior is multi-modal and not normally distributed.