I’ll go over the top websites that show your browser history in this post so you may better understand your online behaviors.
- Key Points & Best Websites That Visualize Your Browsing History List
- 10 Best Websites That Visualize Your Browsing History
- 1.Chrome History Trends
- 2.History Trends Unlimited
- 3.Webtime Tracker
- 4.RescueTime
- 5.Mind the Time
- 6.Trackly
- 7.History Analytics
- 8.BrowsingHistoryView
- 9.Timely
- 10.ActivityWatch
- Conclsuion
- FAQ
These programs measure where and how much time you spend online using timelines, graphs, and charts. These websites offer clear insights to properly manage your digital life, whether for productivity or curiosity.
Key Points & Best Websites That Visualize Your Browsing History List
| Website Name | Key Point on Visualization |
|---|---|
| Chrome History Trends | Visualizes browsing patterns over time with charts |
| History Trends Unlimited | Detailed insights with graphs and usage stats |
| Webtime Tracker | Time spent on websites shown in easy-to-read graphs |
| RescueTime | Categorizes and visualizes productivity trends |
| Mind the Time | Visual timeline of browsing activity with stats |
| Trackly | Visualizes browsing by category and duration |
| History Analytics | Interactive graphs of visited websites and time spent |
| BrowsingHistoryView | Lists and visualizes browsing data from multiple browsers |
| Timely | Time-based visual summaries of browsing history |
| ActivityWatch | Open-source tracker with detailed visual reports |
10 Best Websites That Visualize Your Browsing History
1.Chrome History Trends
A useful tool called Chrome History Trends examines your browser history in Google Chrome to show patterns and trends over time. It creates graphic charts that display the websites you visit most frequently, how much time you spend online each day, and more.

Without being overbearing, the user-friendly design helps consumers understand their browsing patterns. It is simpler to identify periods of high usage and frequently visited websites when the data is presented graphically.
For anyone who want a simple, browser-specific history visualization to increase productivity or better manage their time, this tool is fantastic.
| Feature | Description |
|---|---|
| Browsing Pattern Charts | Visual graphs showing browsing trends over time |
| Most Visited Sites | Highlights frequently visited websites |
| Daily Activity Tracking | Displays daily browsing duration and usage |
| Simple Interface | User-friendly and easy to navigate |
| Chrome-Specific | Works only with Google Chrome browsing data |
2.History Trends Unlimited
By providing comprehensive graphs and statistics, the History Trends Unlimited Chrome extension goes beyond simple browsing history.
It monitors your surfing behavior over several months or years, displaying patterns like the frequency of website visits, the amount of time spent, and your daily browsing routine.
Long-term behavior analysis is made simple by the visualizations, which include pie charts, line graphs, and bar charts. Users can track productivity or find distracting websites with its extensive insights.
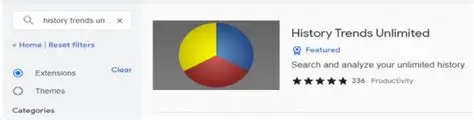
With its extensive, configurable visual reports, the plugin is particularly helpful for users who wish to examine their surfing habits in depth.
| Feature | Description |
|---|---|
| Long-Term Trend Analysis | Tracks browsing patterns over months/years |
| Customizable Graphs | Line, pie, and bar charts to visualize history |
| Frequency & Time Tracking | Shows website visit counts and time spent |
| Detailed Usage Stats | In-depth insights on browsing habits |
| Chrome Extension | Integrates directly with Chrome browser |
3.Webtime Tracker
A browser addon called Webtime Tracker shows you how much time you spend on each page. It keeps track of the websites you visit most frequently and presents the data in the form of vibrant pie charts and bar graphs, making it simple to identify which ones take up the most of your time.
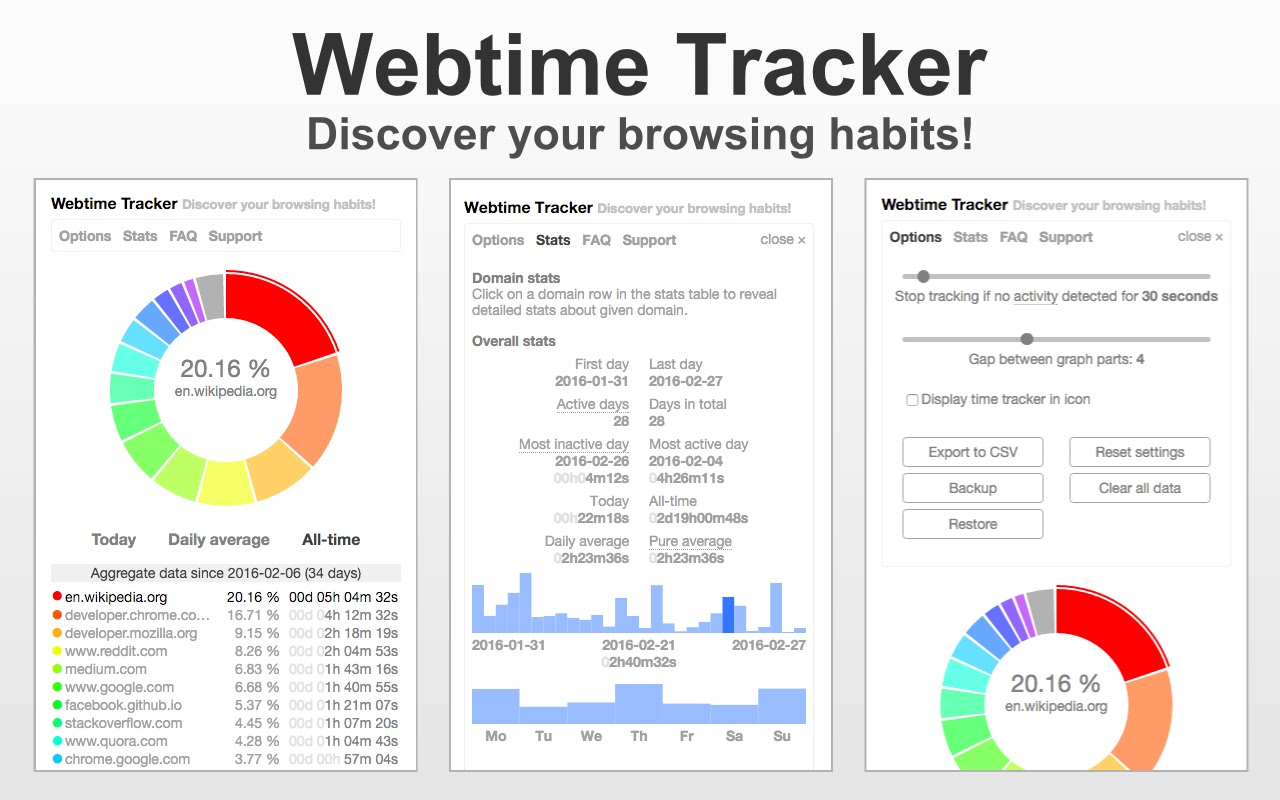
By raising users’ awareness of their digital behaviors, the program promotes improved time management. Additionally, it offers weekly and daily reports to help identify trends or changes.
Webtime Tracker is a great option for anyone wishing to visually track their surfing time and increase their online productivity because of its simple and easy-to-use design.
| Feature | Description |
|---|---|
| Time Spent Visualization | Displays time allocation per website |
| Pie Charts & Bar Graphs | Colorful visual summaries of browsing |
| Daily & Weekly Summaries | Regular reports of browsing activity |
| User-Friendly Design | Simple layout to track digital habits |
| Browser Extension | Works as an add-on for popular browsers |
4.RescueTime
RescueTime is a well-known productivity tool that monitors your background application and surfing activity. It creates thorough visual reports with charts and timelines and classifies websites according to their productivity level.
By knowing how users spend their online time, these insights assist users in identifying distractions and enhancing their ability to concentrate. RescueTime’s dashboard displays daily highlights, objectives, and trends in an eye-catching manner.
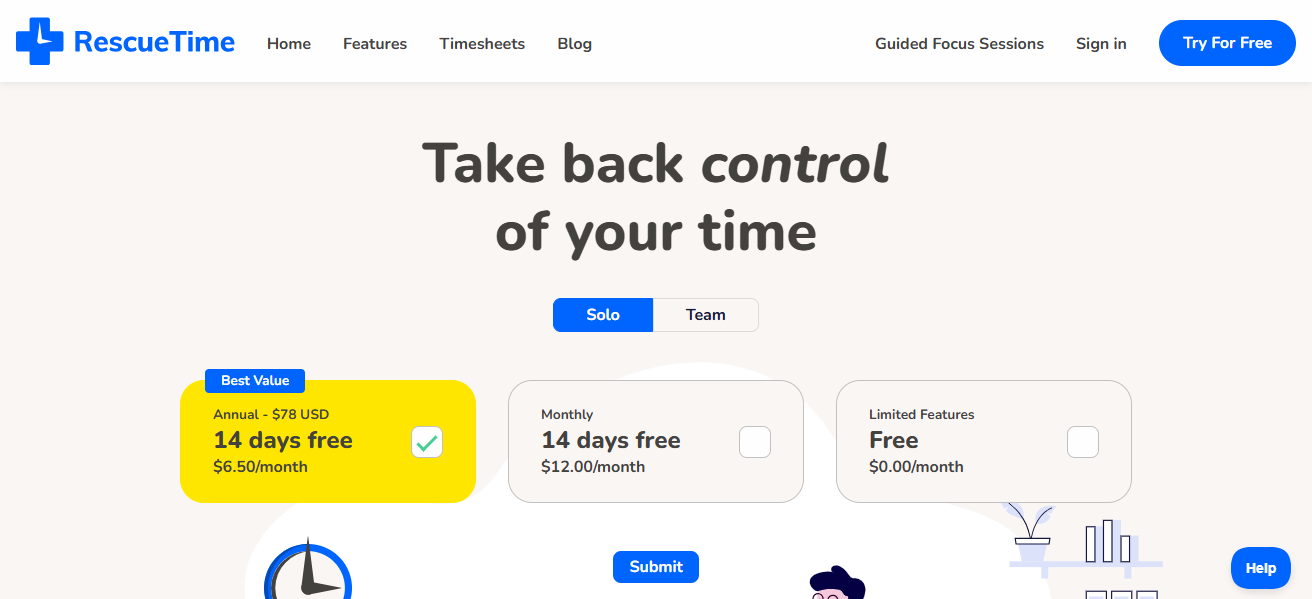
It provides a comprehensive picture of your online behaviors and is compatible with a variety of devices and browsers. Professionals frequently utilize this tool to boost productivity through data-driven self-awareness
| Feature | Description |
|---|---|
| Automatic Tracking | Monitors browser and app usage in the background |
| Productivity Categorization | Classifies sites by productivity levels |
| Visual Reports & Timelines | Charts and timelines for usage patterns |
| Multi-Device Support | Tracks activity across multiple devices |
| Goal Setting & Alerts | Set productivity goals and receive notifications |
5.Mind the Time
A browser plugin called Mind the Time was created to show you a timeline of your surfing history. Your browsing sessions are recorded, and the information is shown using interactive timelines and statistics.
In order to better understand their hourly browsing habits, users can examine the precise time and duration of their visits to specific websites.
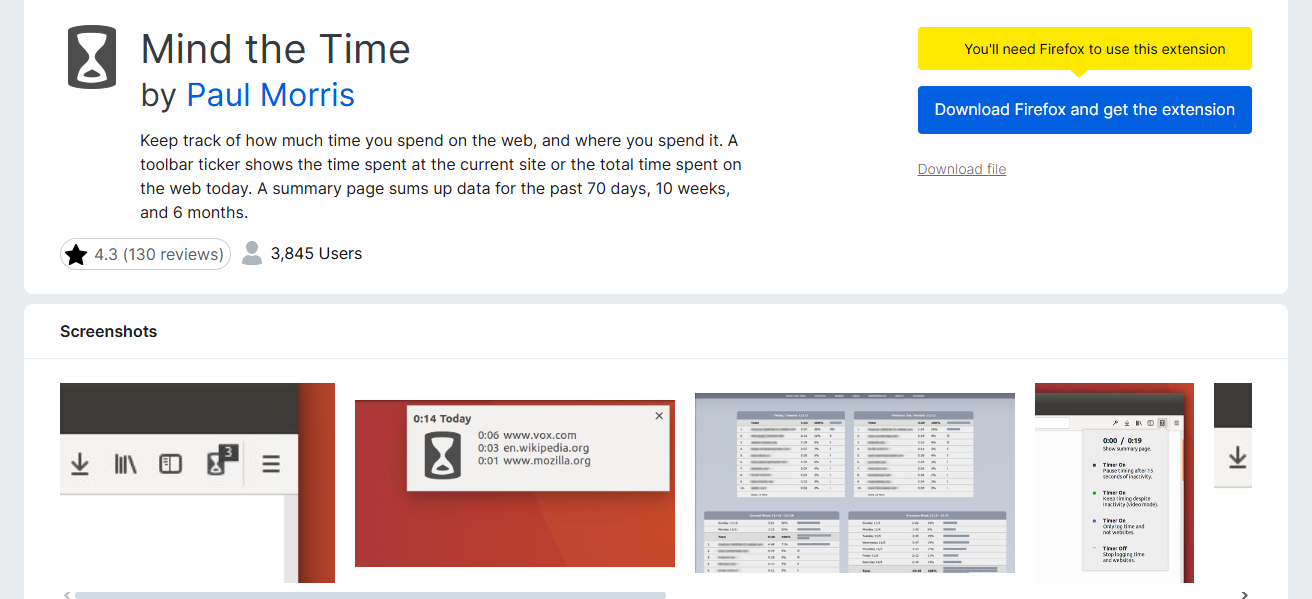
The tool is helpful for determining times when there is a lot of activity or distraction. Users can examine their online activity in a chronological fashion thanks to its simple and easy-to-use timeline representation, which is excellent for time management and productivity enhancement.
| Feature | Description |
|---|---|
| Visual Timeline | Interactive timeline of browsing sessions |
| Hourly Browsing Breakdown | Shows when and how long sites were visited |
| Session Tracking | Records continuous browsing activity |
| Simple Visualization | Clear, chronological format for easy review |
| Browser Extension | Easy to install and use on popular browsers |
6.Trackly
By classifying websites and showing the amount of time spent on each category, the contemporary browser addon Trackly visualizes your browsing history.
Users can rapidly evaluate how they divide their time between work, social media, entertainment, and other activities thanks to its straightforward, color-coded charts and graphs.
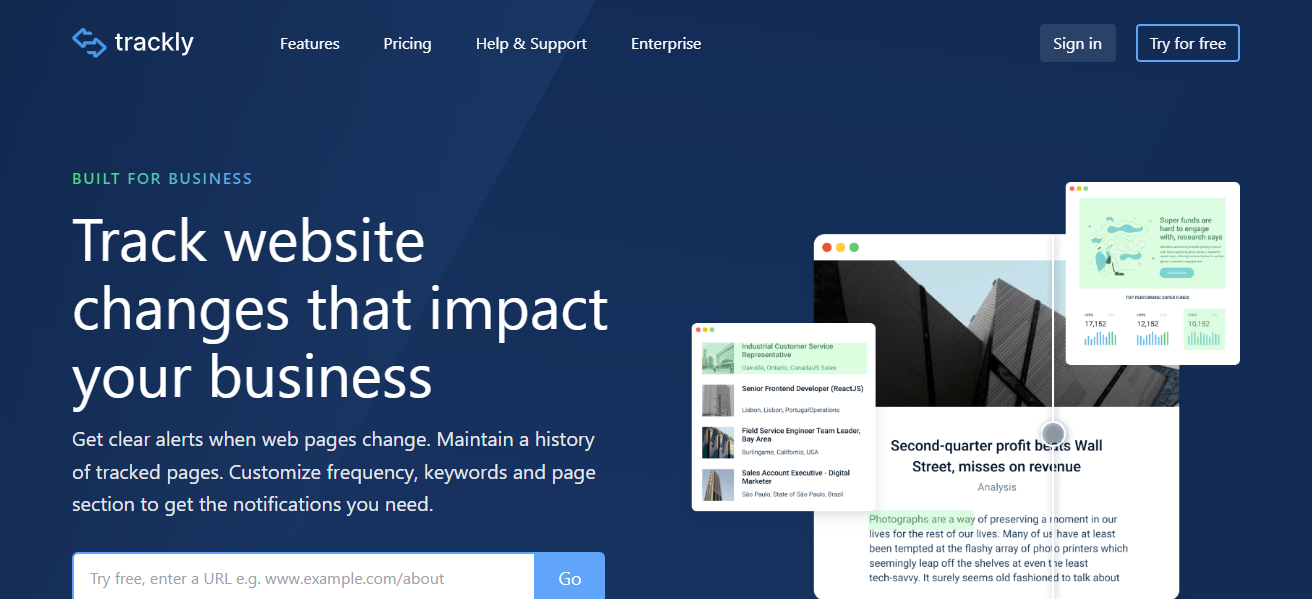
Trackly provides daily and weekly summaries to assist users understand their surfing behavior. Its emphasis on classification makes it simple to identify instances of misuse of ineffective websites or productivity leaks.
With simple, useful insights, this visualization empowers people to take charge of their digital time.
| Feature | Description |
|---|---|
| Categorized Visualization | Time spent grouped by website categories |
| Color-Coded Graphs | Easy-to-interpret charts for quick insights |
| Daily & Weekly Reports | Summaries highlighting browsing trends |
| Focus on Productivity | Helps identify time spent on work vs leisure |
| Browser Add-on | Runs as an extension for Chrome and Firefox |
7.History Analytics
Using interactive charts and graphs, History Analytics provides detailed visualizations of the data you browse. It offers thorough reports on the websites visited, the amount of time spent, and the frequency of surfing.
The tool is appropriate for consumers seeking in-depth information because it works with multiple browsers and can monitor long-term trends. Heatmaps, pie charts, and timelines are examples of visual components that provide a clear image of surfing behavior.
This aids users in recognizing trends and pinpointing potential time wasters. For people who want comprehensive, data-rich visual reports to monitor and maximize their internet activities, History Analytics is perfect.
| Feature | Description |
|---|---|
| Interactive Visuals | Heatmaps, pie charts, and timelines |
| Multi-Browser Support | Works with Chrome, Firefox, Edge, etc. |
| Long-Term Trend Tracking | Monitors browsing behavior over extended periods |
| Detailed Time Reports | Shows frequency and duration of site visits |
| Data Export Options | Export history for further analysis |
8.BrowsingHistoryView
NirSoft’s lightweight program, BrowsingHistoryView, compiles surfing history from several browsers, including Chrome, Firefox, and Edge. Listing URLs, visit counts, and last visit times, it displays all of this aggregated data in a single interface.
Despite having a text-based main interface, it enables data export for external visualization and the creation of custom reports. Users who desire a consolidated view of their browsing history across browsers will find this feature helpful.
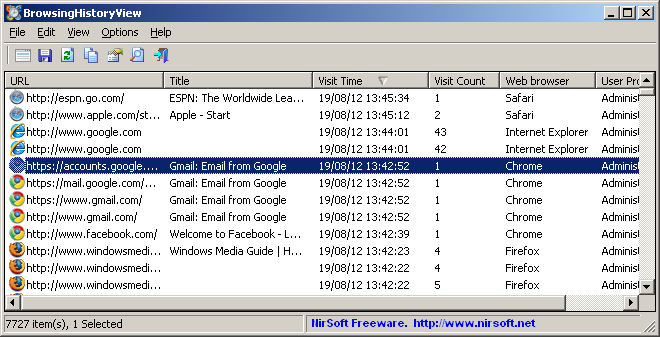
Although creating unique representations from the exported data involves some manual labor, it is ideal for in-depth study or forensics.
| Feature | Description |
|---|---|
| Aggregates Multiple Browsers | Combines history from Chrome, Firefox, Edge |
| Text-Based Interface | Lists URLs, visit counts, and last visited time |
| Export to CSV/HTML | Allows exporting data for external visualization |
| Lightweight & Portable | Small app requiring minimal resources |
| Forensics & Analysis Tool | Useful for detailed browsing investigations |
9.Timely
Timely is a time-tracking application that automatically records the amount of time you spend on webpages and other activities, allowing you to see your browsing history.
It provides a summary of your day using timelines, graphs, and charts, displaying the precise amount of time you spend on different online pursuits.
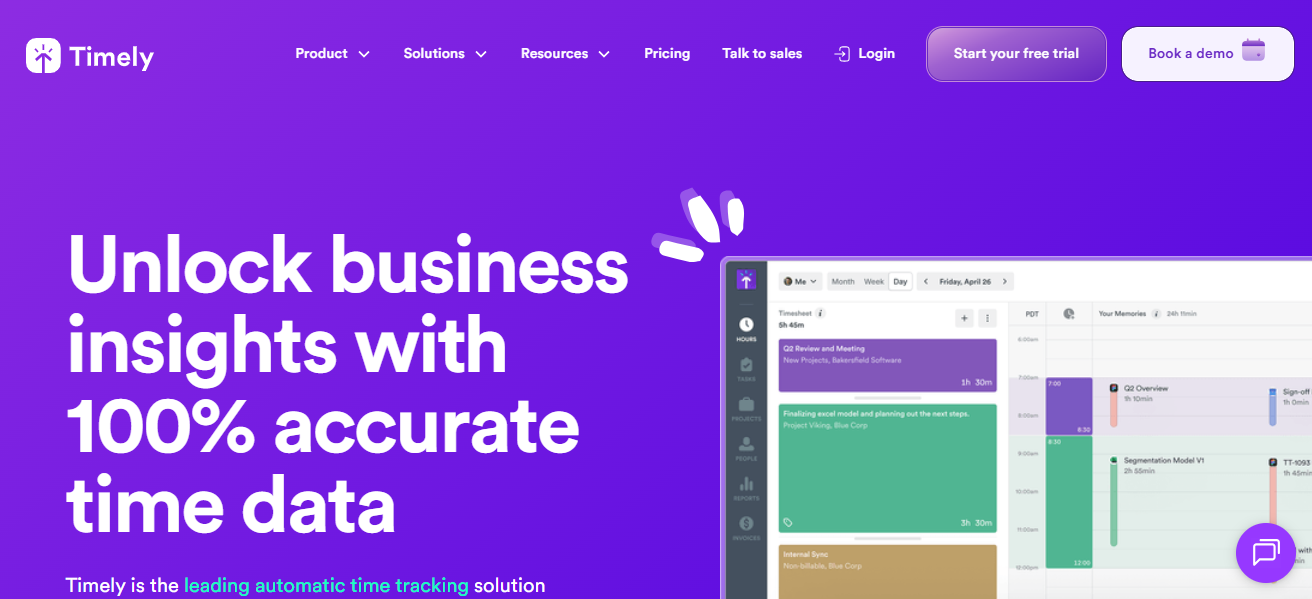
Without requiring manual input, Timely’s emphasis on visual summaries and automated tracking helps users maintain awareness of their time utilization.
Users may identify time sinks and modify habits for increased productivity and work-life balance thanks to its simple, contemporary UI, which also makes data interpretation simple.
| Feature | Description |
|---|---|
| Automatic Time Tracking | Logs time spent on websites without manual input |
| Timeline & Graph Summaries | Visual overview of daily and weekly activity |
| Task & Project Categorization | Assigns browsing to specific tasks/projects |
| Clean, Modern Interface | Easy-to-understand visual summaries |
| Multi-Platform Support | Works on web, desktop, and mobile devices |
10.ActivityWatch
An open-source automatic time-tracking program called ActivityWatch keeps tabs on your application and internet usage and generates comprehensive visual reports.
It monitors activity across several browsers and devices, compiling information into timelines and graphs that are simple to comprehend.
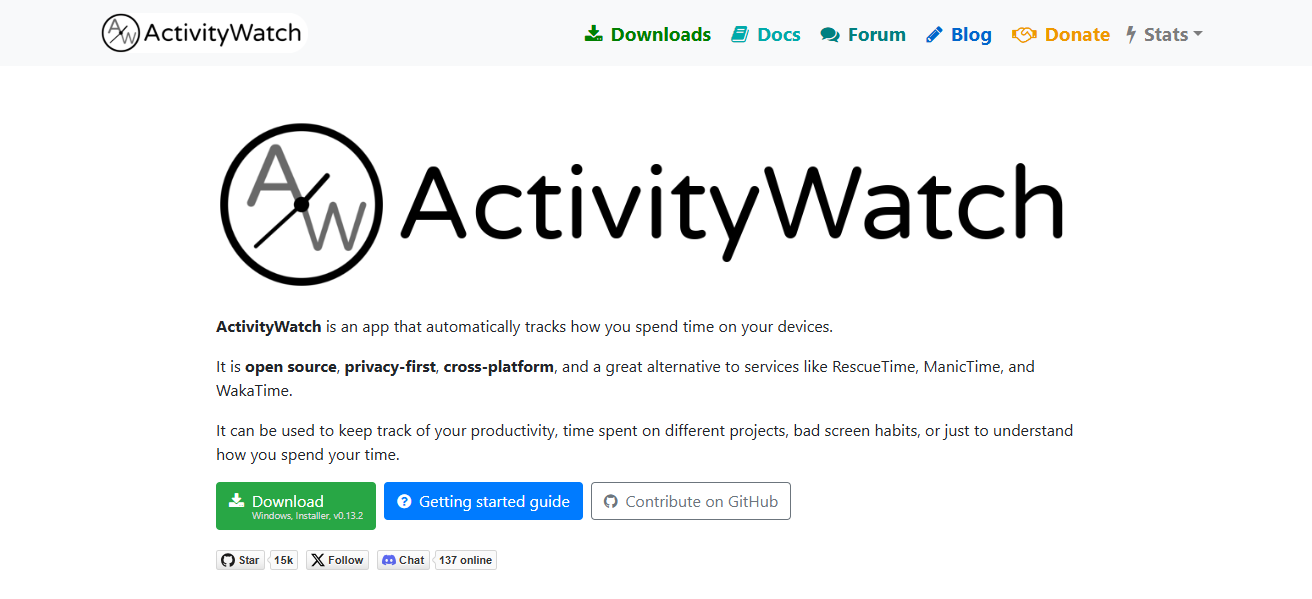
Users can export data for additional analysis and alter visuals. Because it is open-source, users have complete control over their data and privacy is respected.
For people looking for a strong, adaptable application to track online behaviors, view browser history, and boost productivity with comprehensive, easy-to-understand reports, ActivityWatch is fantastic.
| Feature | Description |
|---|---|
| Open-Source & Privacy-Focused | Fully transparent and user-controlled tracking |
| Cross-Platform Tracking | Supports Windows, macOS, Linux, and browsers |
| Detailed Visual Reports | Timelines, bar charts, and customizable graphs |
| Automatic Activity Logging | Tracks browsing and app usage without manual input |
| Data Export & API Access | Export data and connect with other tools easily |
Conclsuion
In conclusion, leading websites provide effective means of visualizing your browsing history, which aids in understanding and controlling your online behaviors.
Each offers distinct capabilities for time tracking, productivity analysis, and in-depth insights, ranging from straightforward Chrome-specific apps like Chrome History Trends to extensive trackers like RescueTime and open-source ActivityWatch.
You may effectively increase your productivity and raise your level of digital awareness by selecting the appropriate tool.
FAQ
It’s a tool or website that tracks and displays your web activity using charts, graphs, or timelines for easier understanding.
Most reputable tools respect privacy, especially open-source ones like ActivityWatch. Always check permissions before use.
Yes, tools like RescueTime and ActivityWatch track both browsing and app usage.