In this post , I will outline the Crypto Tools That Feel Like Magic, highlighting the powerful platforms that simplify complex blockchain data.
These tools help smart money, and DeFi activity tracking; token distribution visualization; and market trend monitoring. Tools provide ease to help beginners and professional traders make better decisions during crypto trading.
Key Points & Crypto Tools That Feel Like Magic (But Actually Work)
- Arkham Intelligence – Tracks blockchain addresses, revealing hidden connections and identities with powerful on‑chain analytics.
- DeFiLlama – Aggregates decentralized finance data, showing TVL, yields, and protocols across multiple blockchains instantly.
- Nansen – Provides wallet intelligence, tracking smart money flows, token movements, and market sentiment in real time.
- DEXTools – Monitors decentralized exchanges, offering live charts, trading pairs, and liquidity pool insights for traders.
- Bubblemaps – Visualizes token holder distributions, exposing suspicious clustering and potential manipulation in crypto ecosystems.
- CryptoQuant – Delivers on‑chain metrics, exchange flows, and market indicators to guide crypto trading strategies effectively.
- TradingView – Offers advanced charting tools, technical indicators, and social trading features for global financial markets.
- Dune Analytics – Enables custom dashboards and queries, turning blockchain data into interactive, shareable visual insights.
- Token Unlocks – Tracks vesting schedules, showing upcoming token releases that may impact market supply dynamics.
- CoinTracking – Manages portfolios, calculates taxes, and generates detailed reports for crypto investors worldwide.
10 Crypto Tools That Feel Like Magic (But Actually Work)
1. Arkham Intelligence
Arkham Intelligence has a magic trait because it provides real-world identities linked to anonymous block chain wallets with the help of advanced on-chain analytics and AI.
Users can track whale wallets, institutional wallets, and even government wallets by tagging wallet addresses and exposing hidden transactional relationships.
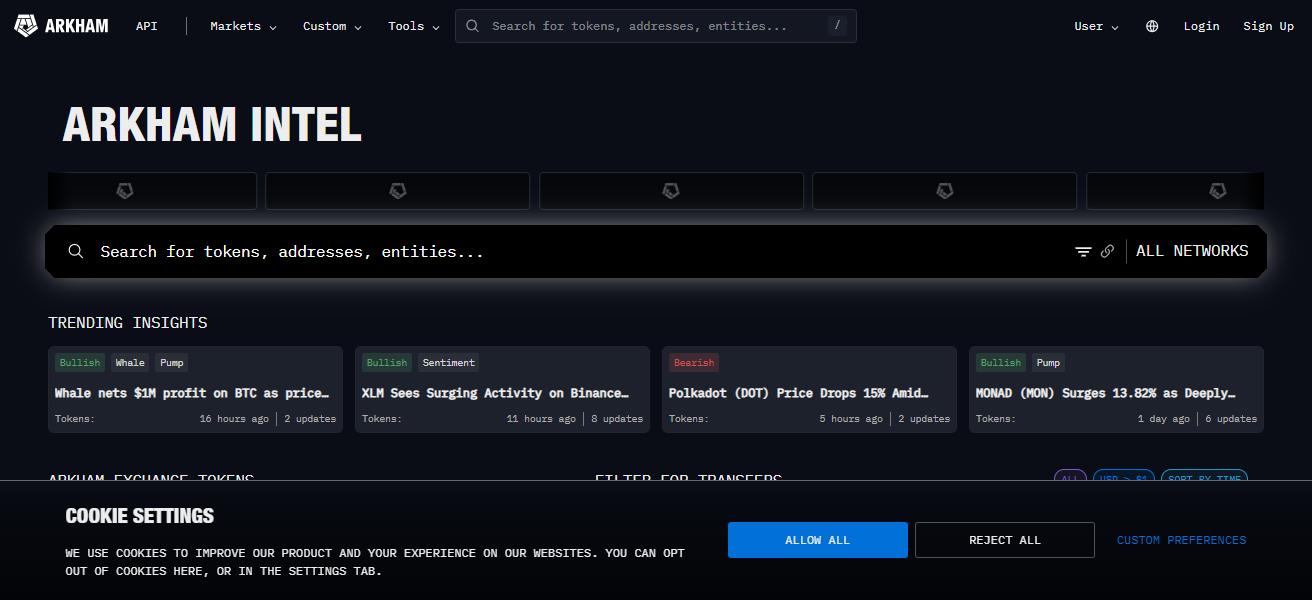
Many traders use the platform to track the movement of large funds, as it often determines the direction of the market.
Many investigators use the platform to track the movement of large funds. The Intel Exchange provides a market for buying and selling blockchain intelligence.
Because the Arkham platform relies on publicly available data, it constitutes a real tool for transparency, as opposed to a real tool for a breach of data.
Arkham Intelligence Features
- Tracking Wallets: Identifies the owners of pseudonymous wallets and monitors their activities.
- Whale and Big Player Movement Tracking: Identifies the movement of large sums of money which is likely to impact the market.
- Intelligence Trade: Buy and sell intelligence reports; access intelligence reports of the blockchain.
- Fraud and Theft Investigation: Traces the movement of suspicious funds and investigates the network
| Pros | Cons |
|---|---|
| Connects anonymous wallets to real-world identities for deep insights. | Can be overwhelming for beginners due to complex analytics. |
| Tracks whales, institutions, and government activity. | Premium features may be expensive. |
| Useful for fraud detection and investigating suspicious flows. | Limited to publicly available on-chain data. |
| Intel Exchange allows buying and selling blockchain intelligence. | Requires interpretation skills to make actionable decisions. |
2. DeFiLlama
DeFiLlama aggregates Total Value Locked (TVL) data for hundreds of decentralized finance protocols and blockchains.
It simplifies hundreds of disconnected decentralized finance complexities into real-time dashboards, and users don’t have to connect wallets or log in to access the data.
Users can rely on DeFiLlama for discovering trending protocols and for comparative yield and liquidity flow analyses.
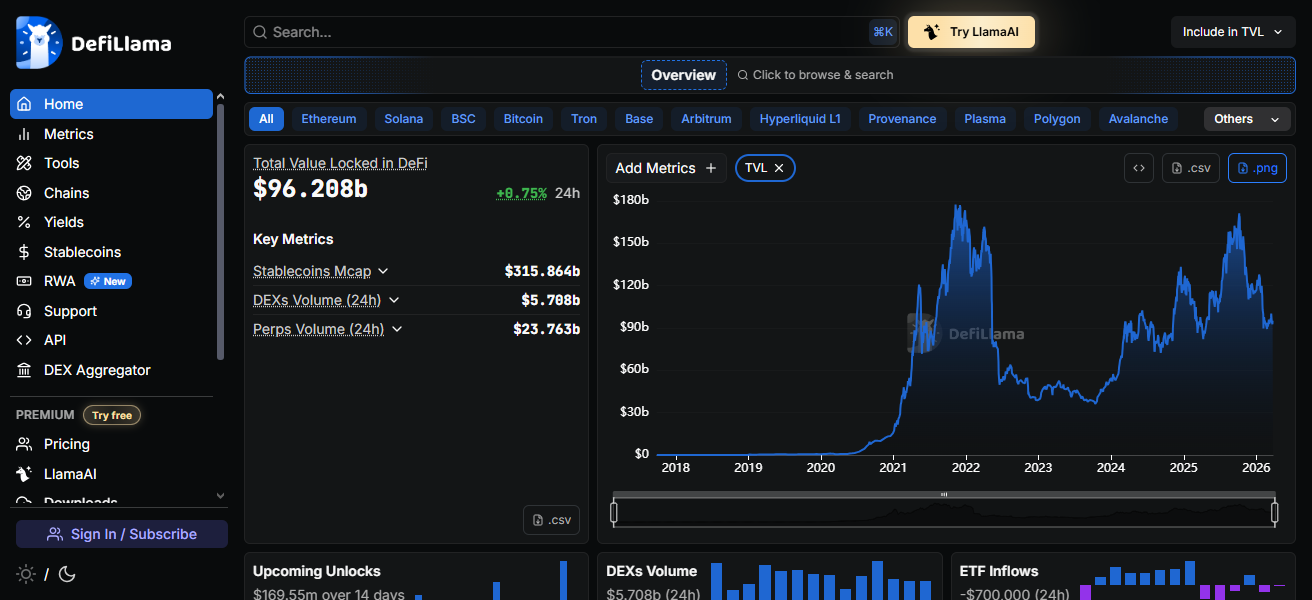
Users can also find the information on stablecoins, bridges, and the revenue of protocols. Many users find DeFiLlama’s data to be trustworthy as DeFiLlama does not engage in paid promotions.
DeFiLlama indexes on-chain smart contract data, which provides users transparency in DeFi activity.
DeFiLlama Features
- TVL Tracking: Tracks the Total Value Locked of all DeFi platforms and blockchains.
- Defi Protocols Yield Comparison: Compare projects by liquidity, yield, and top trending.
- Bridge and Stablecoin Flow Tracking: Track the movement of assets and stablecoins across different chains.
- On-chain Data Transparency: No sponsored content or promotions; all data comes from on-chain smart contract data.
| Pros | Cons |
|---|---|
| Aggregates TVL across hundreds of DeFi protocols. | Limited to DeFi protocols; not useful for centralized exchange data. |
| Free and transparent, avoiding paid promotions. | Does not provide predictive market insights. |
| Simplifies complex DeFi ecosystems into clear dashboards. | May require manual analysis for deep insights. |
| Tracks bridges, stablecoins, and protocol revenues. | Some protocols may have delayed or incomplete data. |
3. Nansen
Nansen makes it easy to understand blockchain data by tagging wallets and assigning them to different categories of smart money.
It is magical because users can track the real time moves of top investors and venture funds as well as successful traders.
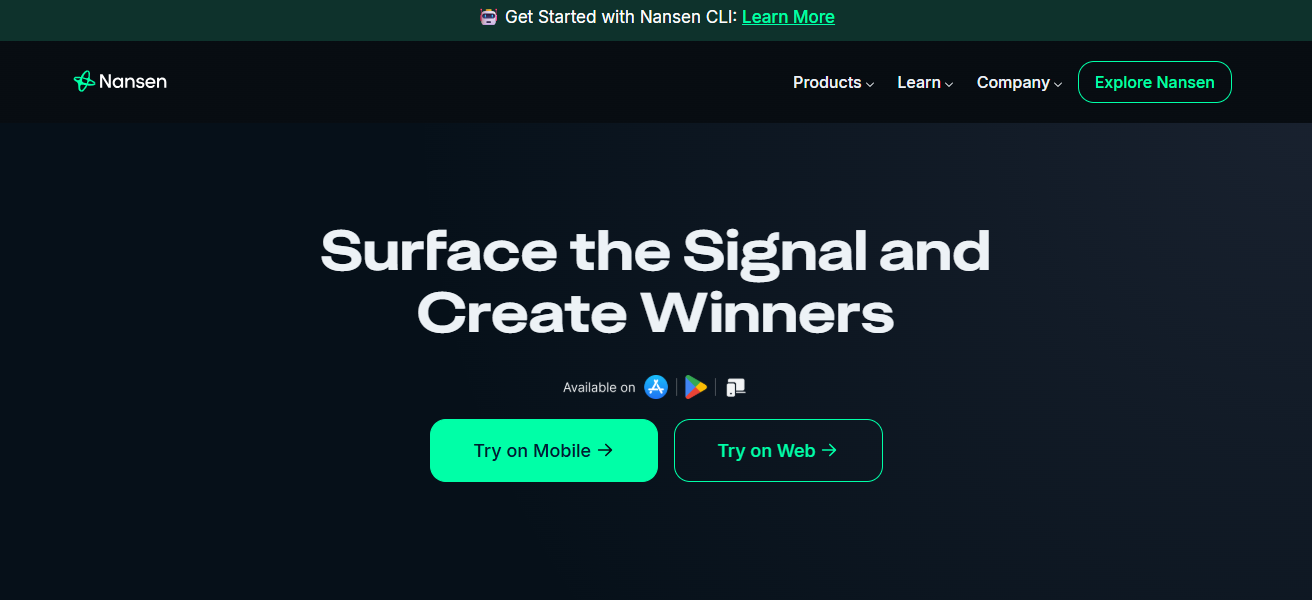
This enables retail traders to copy smart moves or find trends earlier. Nansen’s dashboards can display token inflow data, NFT trading data, and wallet profits. It applies a combination of machine learning and layered data to find patterns and trends.
Nansen is a tool for supporting decisions, rather than making predictions, and users should interpret the data because it can be risky to just follow wallets.
Nansen Features
- Smart Money Tracking: Identifies wallets of leading investors and funds.
- Wallet Activity Tracking: Monitor token movements, NFT sales, and wallets.
- Emerging Trends: Recognize new opportunities before widespread adoption.
- Machine Learning: Identifies patterns and wallet activity through AI.
| Pros | Cons |
|---|---|
| Labels wallets and tracks “smart money” in real time. | Premium pricing may be high for casual traders. |
| Provides dashboards on token inflows, NFTs, and wallet profits. | Blindly following wallets can be risky. |
| Uses machine learning to detect patterns and trends. | Requires some understanding of blockchain data. |
| Helps identify emerging market trends early. | Not a prediction tool; insights need interpretation. |
4. DEXTools
Users can track essential data for newly launched tokens, as well as market trends and overall token prices, making DEXTools traders` best friend for decentralized exchanges.
It enables users to observe live trades, price charts, and trading pairs within a liquidity pool across blockchains.
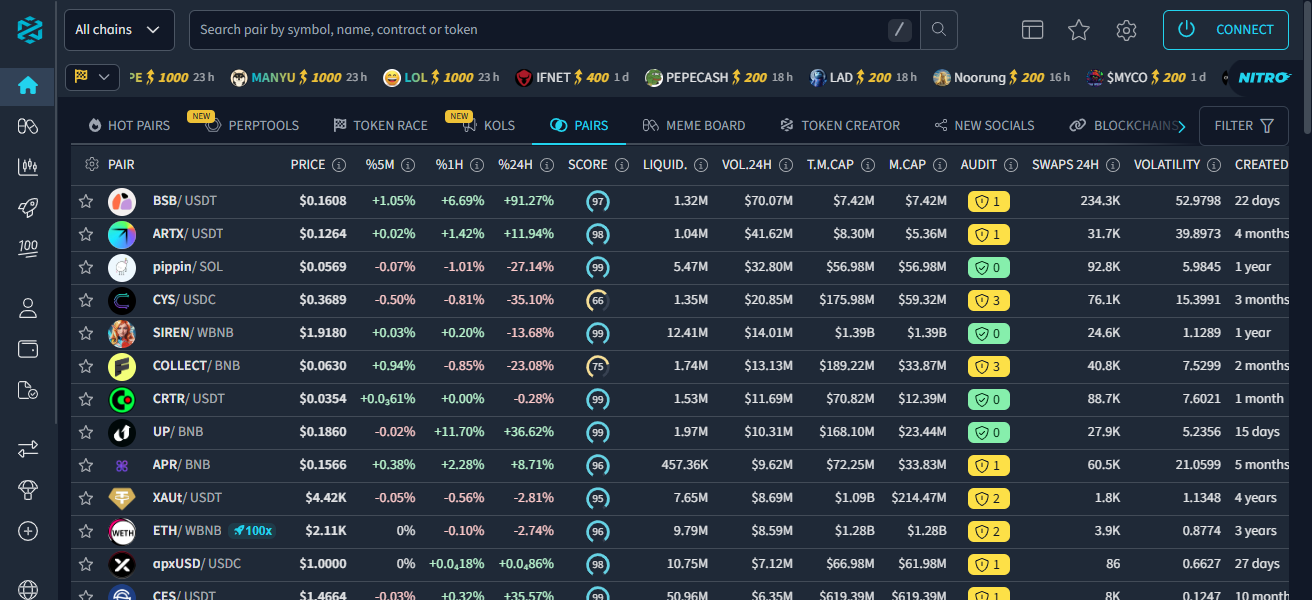
Its best function is as a market overview because users are able to instantly find newly launched tokens, and in a fast market, tokens can be easily lost.
They help traders find market movements, rug pulls, and strange trading volume. It works like other programs by indexing blockchain data via DEX contracts. Early tokens are still dangerous, and traders should follow this tip before jumping in.
DEXTools Features
- Investigate DEX Data: Monitoring prices, real-time trades, and liquidity pools.
- New Token Monitoring: Real-time detection of new tokens.
- Volume & Pump Analysis: Trade volumes and pump manipulation analysis.
- Cross-chain Support: Functions across various decentralized exchanges.
| Pros | Cons |
|---|---|
| Provides live DEX trading data across multiple chains. | Early-stage tokens carry high risk and volatility. |
| Detects newly launched tokens instantly. | Overreliance can lead to chasing pumps. |
| Monitors liquidity pools and trading volume spikes. | Limited to decentralized exchanges only. |
| Useful for spotting potential rug pulls. | Does not provide fundamental project analysis. |
5. Bubblemaps
Bubblemaps analyzes complex data on token holders and simplifies it into beautiful interactive maps and shows users potential relevant links between different wallets.
Bubblemaps created something that feels magical because users can quickly tell if a project’s tokens are stuck with a few insiders or are dispersed.
Each bubble represents a wallet and the links show relationships that can help indicate potential manipulation or collusion. It’s very useful to analyze a scam or coordinated dump.
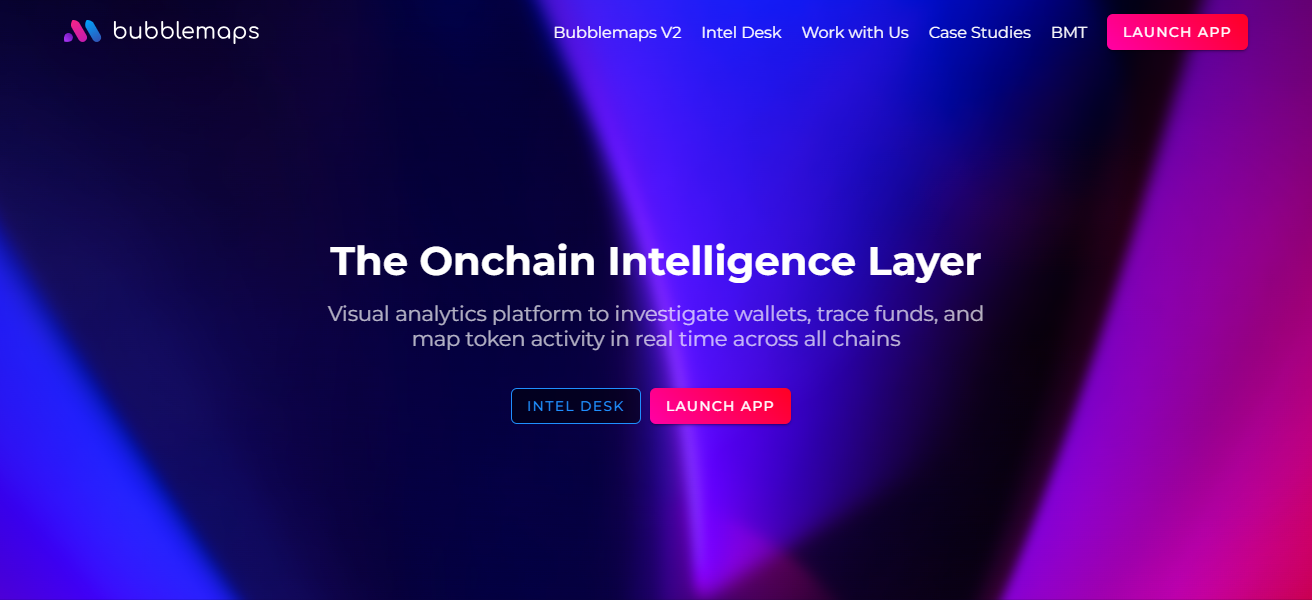
Bubblemaps analyzes token distribution and the history of transfers on the chain. Bubblemaps can provide data analysis that would take an extraordinary amount of time to analyze manually on the blockchain.
On the most basic level of Bubblemaps, you are able to gain an extraordinary amount of knowledge from a basic on-chain analysis.
Bubblemaps
- Interactive Token Maps: Interactive maps to show distribution and concentration of wallets.
- Links Between Wallets: Display and analyze relationships of movement.
- Scam & Collusion Token Manipulation: Detect collusion or scams in token holdings.
- On-chain Insights: Transparency and on-chain analysis of previous token transfers.
| Pros | Cons |
|---|---|
| Labels wallets and tracks “smart money” in real time. | Premium pricing may be high for casual traders. |
| Provides dashboards on token inflows, NFTs, and wallet profits. | Blindly following wallets can be risky. |
| Uses machine learning to detect patterns and trends. | Requires some understanding of blockchain data. |
| Helps identify emerging market trends early. | Not a prediction tool; insights need interpretation. |
6. CryptoQuant
To traders, CryptoQuant holds the priceless means of evaluating on-chain metrics like inflows to exchanges, miner movements and whale behavior, making it feel somewhat like a crystal ball.
When big shifts in the blockchain are noticed (typically indicating market pressure to sell), traders examine the data to estimate upcoming price shifts.
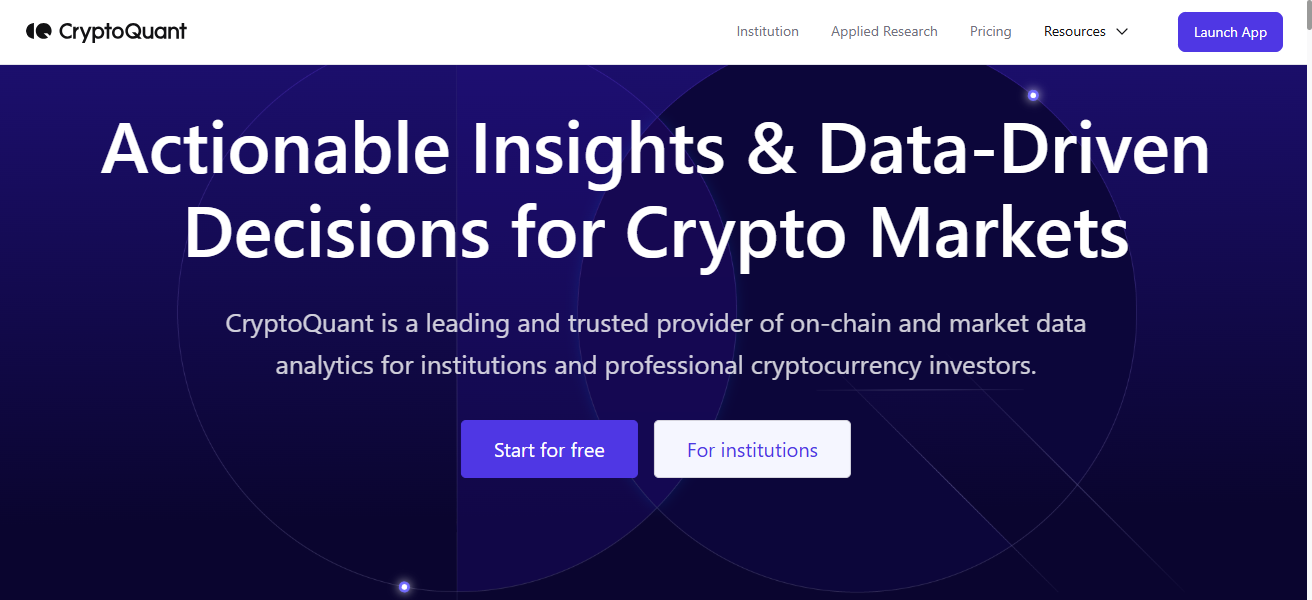
CryptoQuant also provides data on derivatives, covering funding rates and open interests. The brilliance of the platform lies in the adoption of the most relevant metrics to easily interpretable graphs.
It can’t predict the future, but it can depict the market’s mind and action, enabling traders to navigate the market more effectively.
CryptoQuant Features
- In & Out Flow Analysis: Predict selling or buying of assets through token accumulation.
- Whale & Miner Activity Tracking: Analytics on big holders & miners.
- Derivatives Analytics: Funding rates, open interests, & market sentiment.
- Market Outlook Support: Analytics to assist trading decisions.
| Pros | Cons |
|---|---|
| Tracks exchange inflows/outflows to anticipate price movements. | Premium subscription needed for full features. |
| Monitors whale and miner activity. | Can be complex for beginners. |
| Provides derivatives analytics like funding rates and open interest. | Not a guarantee of market predictions. |
| Aggregates blockchain and exchange data into charts. | Interpretation skills required for actionable insights. |
7. TradingView
TradingView is regarded as one of the best crypto charting tools. Its advanced technical analysis features are one of the reasons for its popularity.
Trading tools like customizable indicators, community-based strategies, advanced drawing tools, and more make TradingView seem “magical.”
Back testing, idea automation, and complex indicator implementations are all possible on the platform.
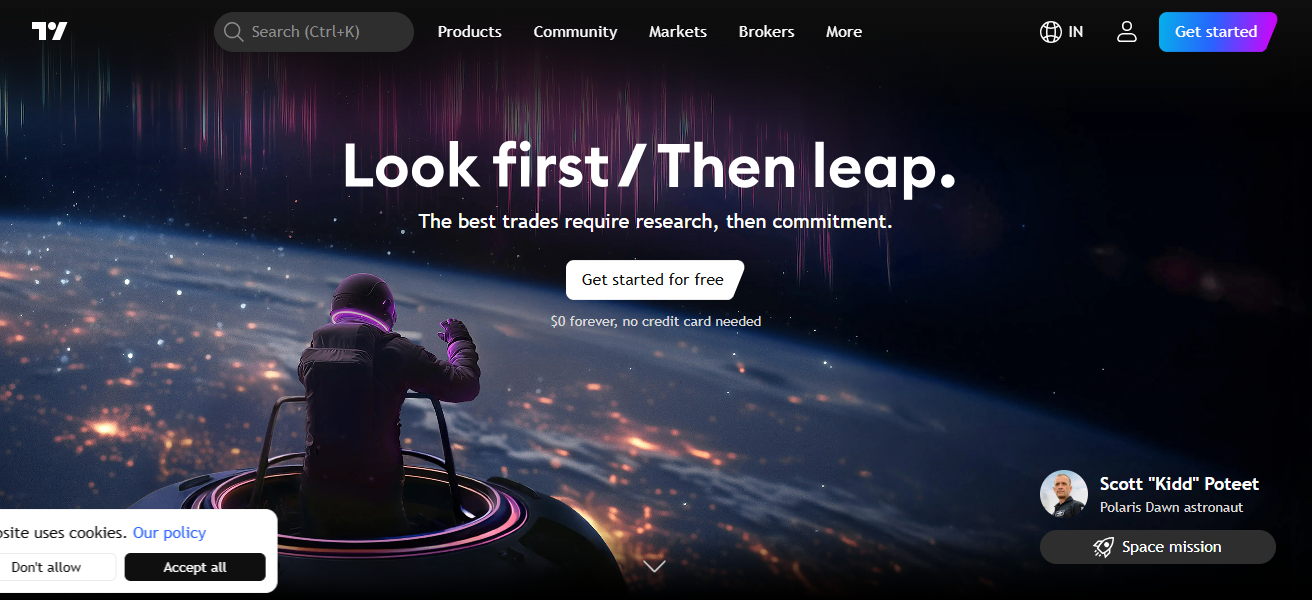
Also, there are social features that allow people to post charts and analyses of the market. Their strongest feature is the social analytics combined with the data visualization.
TradingView empowers people to evolve in their ability to interpret price movements and improve trading strategies, though they don’t claim to predict the market.
TradingView Features
- Advanced Charting: Custom indicators, customization options, and overlays to enhance charts.
- Backtesting & Strategy: Test trading strategies on previous market performance.
- Trade Automation: Automate alerts and strategy trading for efficiency.
- Shared Community Ideas: Public charts, strategies, and ideas can be followed.
| Pros | Cons |
|---|---|
| Advanced charting tools with indicators and overlays. | Free plan has limited features. |
| Allows strategy backtesting and automation. | Steep learning curve for beginners. |
| Community-driven charts, signals, and trading ideas. | Can be overwhelming with too many indicators. |
| Supports multiple asset classes beyond crypto. | Real-time alerts sometimes delayed on free plans. |
8. Dune Analytics
Dune Analytics creates interactive dashboards from SQL queries on blockchain data, making on-chain queries accessible to people who don’t want to deal with complicated setups.
Analysts and researchers can utilize Dune when monitoring the use of protocols, governance, NFTs, and trends. Valuable insights can be acquired from community dashboards.
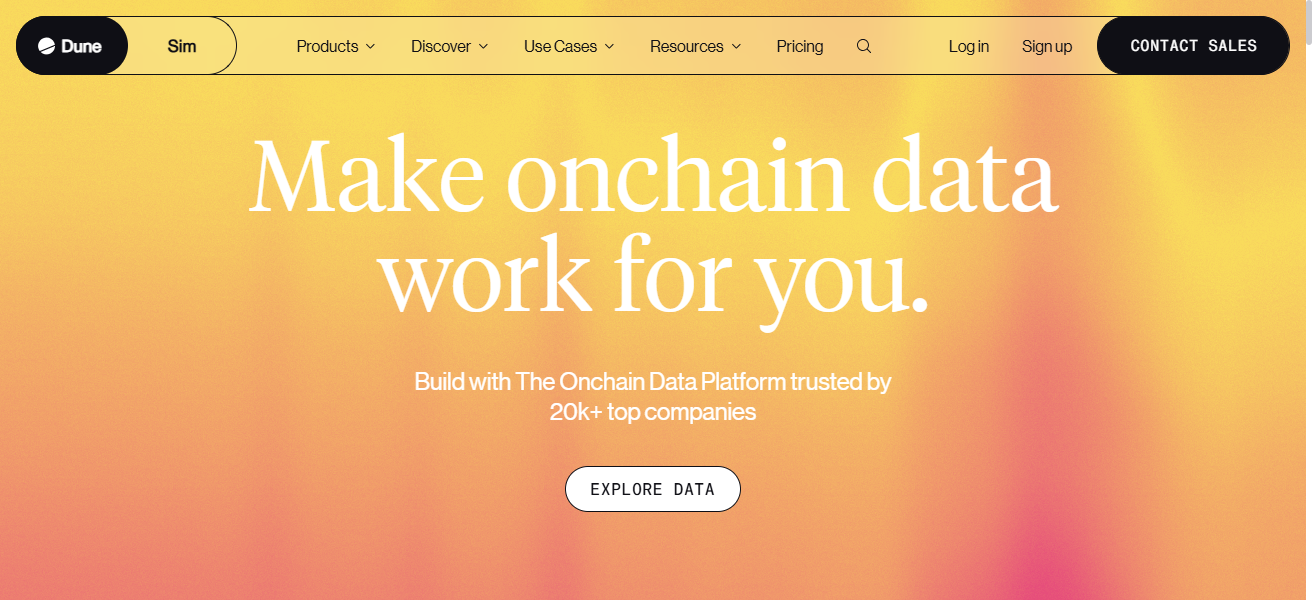
Most of the data indexed on the Blockchain can be queried, making Dune very powerful. Unfortunately, it can be complex and is best when used by developers, researchers, and traders that require accuracy.
Dune Analytics Features
- Blockchain Data & SQL: Write customized queries to directly fetch data.
- Custom Reports: Visual dashboards from raw data.
- Dashboards: Community shared dashboards for insight.
- Protocol Analysis: Monitor usage of DeFi, NFTs, and governance activities.
| Pros | Cons |
|---|---|
| Custom SQL queries allow deep blockchain analysis. | Requires technical knowledge to fully utilize. |
| Turn queries into interactive dashboards. | Can be time-consuming to create dashboards. |
| Community-created dashboards provide ready-made insights. | Limited real-time trading features. |
| Supports tracking DeFi, NFT, and governance activity. | Best suited for analysts, researchers, or developers. |
9. Token Unlocks
Token Unlocks is a tool that tracks upcoming token releases. Potential new events in the market are important to any investor and Token Unlocks shows users new potential events in the market.
The more a token release is planned, the more the price is expected to fluctuate. People avoid buying in before locks are planned so they can strategically position themselves for a good potential new event.
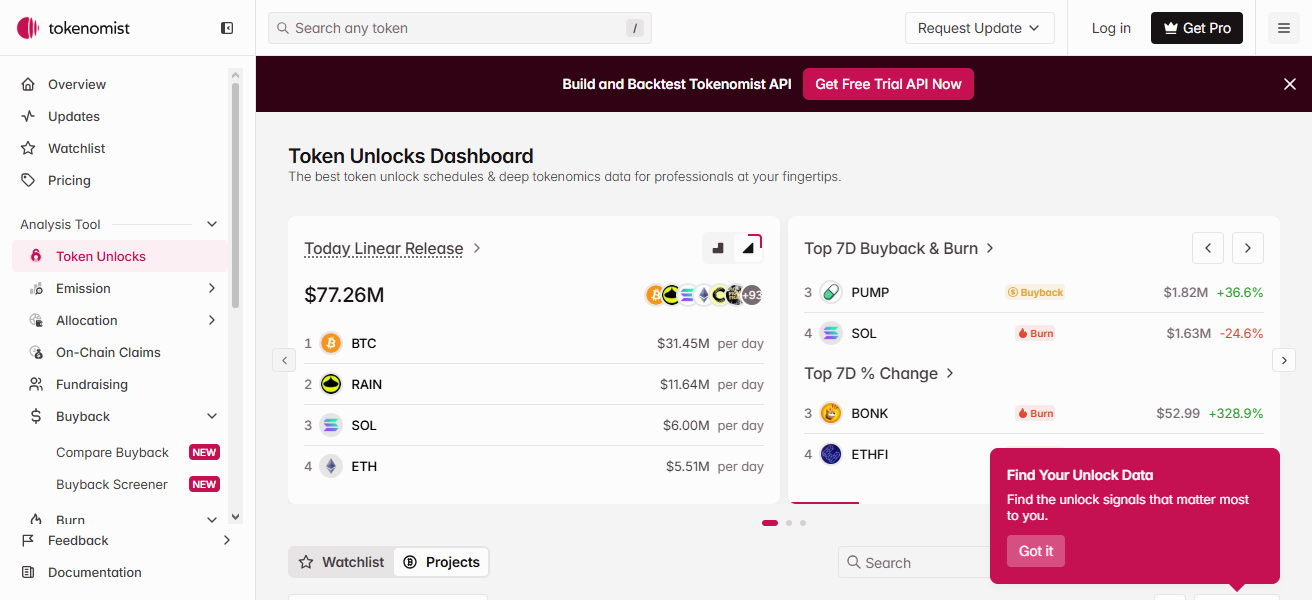
Token Unlocks shows new events by compiling the vesting event schedules for the team, investors, and costs and omics.
The more transparent new events are, the more the users understand the potential long-term impact of the event and the more they manage the risks of dilution.
Token Unlocks Features
- Token Release Surveillance: Monitors timelines of unlocks and vesting schedules.
- Market Volatility Alerts: Alerts supply-related price volatility.
- Investor & Team Insights: Vesting breakdowns by stakeholder group.
- Clear Tokenomics: Smart contract + public data visibility.
| Pros | Cons |
|---|---|
| Tracks upcoming token unlock schedules. | Limited to tokenomics and vesting data. |
| Helps anticipate potential market supply shocks. | Not a trading or portfolio management tool. |
| Provides detailed vesting schedules for teams and investors. | Requires cross-referencing with other market data for full analysis. |
| Transparent and publicly sourced data. | Does not predict price movement directly. |
10. CoinTracking
CoinTracking organizes a crypto investors portfolio by tracking the investor’s trades, profits, losses, and taxes.
It is built to pull data from various crypto investors that use decentralized trades from wallets to display all the data in one area.
The investor can have all the data they need in one place and can generate reports from the tracking system.
The reports can be used to analyze the investor’s portfolios, and to measure taxes for the amount of the trading involved. There are many tradeable currencies and multiple useable currencies that are integrated into the platform.
The tool imports the history of all trades from all users. There is a high usefulness in the tool due to its high reliance on data. This tool is highly valued by people who trade and invest a lot in order to keep high records.
CoinTracking Features
- Portfolio Integration: Merges holdings across exchanges and wallets.
- Tax & Reporting Features: Accurate reporting of trade-related taxes.
- Profit & Loss Tracking: Captures trading and long-term investment performance.
- API Integration: Automated updates across platforms.
| Pros | Cons |
|---|---|
| Aggregates portfolios across exchanges and wallets. | Accuracy depends on proper data import. |
| Tracks profits, losses, and trading performance. | Complex setup for beginners. |
| Generates detailed tax reports and compliance support. | Some features require a paid subscription. |
| Supports a wide range of cryptocurrencies and APIs. | Advanced features can be overwhelming for casual investors. |
Conclsuion
To end, Crypto Tools That Feel Like Magic (But Actually Work) provide an opportunity for traders, investors, and analysts to work through the complex world of crypto, and achieve strategy confidence.
The ability to obtain real-time insights, visualizations, and actionable data simplifies the decision-making process, increases the user’s ability to see through the fog, and helps capture opportunities that formerly were undiscovered.
These tools provide the ability to track smart money, DeFi, and token unlocks and provide the ability to work through the complexity of the blockchain into real-world applications.
FAQ
Visualizes wallet distributions and token transfers to detect concentration or manipulation.
Tracks on-chain metrics like exchange inflows, whale activity, and derivatives data
Analysts and researchers seeking customizable dashboards from blockchain data.
Tracks token vesting and upcoming unlocks to anticipate market supply changes.