In this article I will look into different Application Performance Monitoring (APM) Software that help companies make sure their applications work effectively and efficiently.
- Key Points & Best Application Performance Monitoring (APM) Software
- 10 Best Application Performance Monitoring (APM) Software
- 1. Dynatrace
- 2. New Relic
- 3. AppDynamics
- 4. Datadog
- 5. Splunk APM
- 6. Elastic APM
- 7. ManageEngine Applications Manager
- 8. SolarWinds AppOptics
- 9. Instana
- 10. Stackify Retrace
- How We Choose Best Application Performance Monitoring (APM) Software
- Cocnlsuion
- FAQ
APM tools monitor performance and detect issues and provide actionable and insightful suggestions that improve user experience.
From Datadog to Dynatrace, these tools provides tracking, analyzing, and optimizing applications and have advanced features for today’s cloud, hybrid, and microservices environments.
Key Points & Best Application Performance Monitoring (APM) Software
| APM Tool | Key Point |
|---|---|
| Dynatrace | AI-powered full-stack monitoring with automatic root cause analysis |
| New Relic | Unified observability platform combining metrics, logs, and traces |
| AppDynamics | Business transaction monitoring linking app performance to business outcomes |
| Datadog | Cloud-native monitoring with strong integrations across DevOps tools |
| Splunk APM | Real-time troubleshooting with distributed tracing and analytics |
| Elastic APM | Open-source observability integrated with the Elastic Stack |
| ManageEngine Applications Manager | Affordable monitoring solution for SMBs and enterprises |
| SolarWinds AppOptics | Lightweight monitoring with easy setup and dashboards |
| Instana | Automatic discovery of microservices and dynamic environments |
| Stackify Retrace | Developer-focused APM with code-level insights and error tracking |
10 Best Application Performance Monitoring (APM) Software
1. Dynatrace
Dynatrace is an all-in-one APM solution that includes AI-based automation for real-time monitoring of applications, infrastructure, and user experience.
It provides comprehensive observability and offers deep understanding of performance bottlenecks, code-level problems, and dependencies.
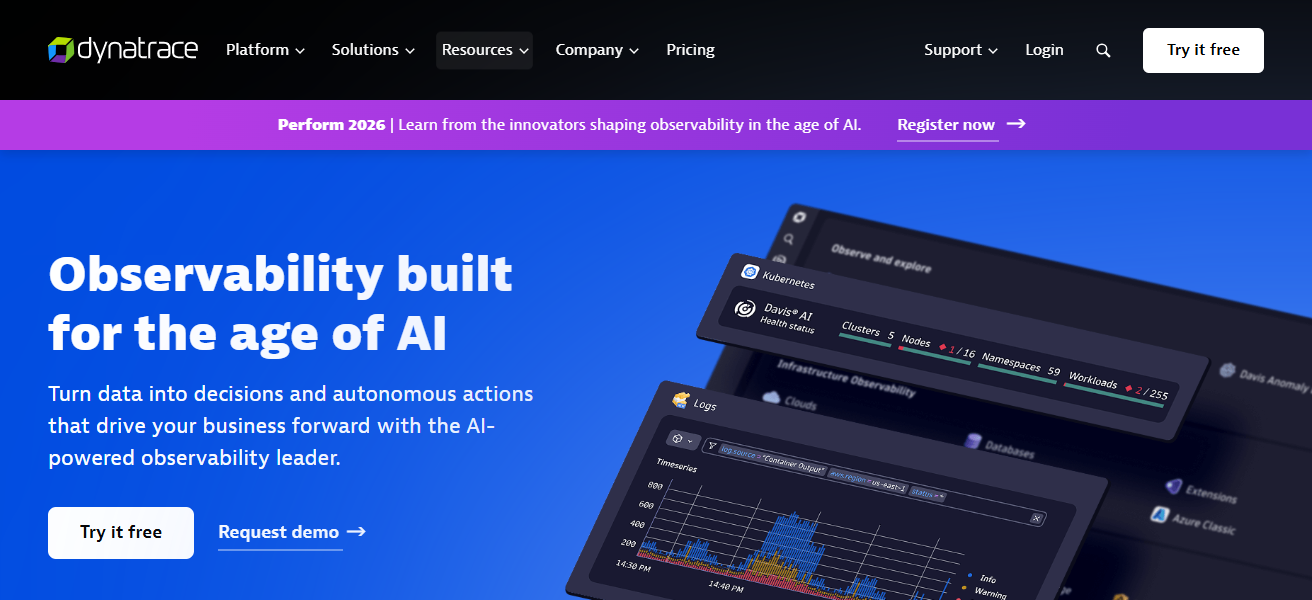
Its automatic root cause analysis cuts down on time needed for troubleshooting, and seamless integration with cloud platforms and microservices is perfect for complicated settings.
Dynatrace’s user-friendly dashboards, powerful analytics, and customizable alerts assist teams in optimizing the performance of applications, improving user experience, and streamlining DevOps processes.
Features Dynatrace
AI-Powered Root Cause Analysis – Uses AI to analyze the causes of issues in performance, which speeds up the problem solving process.
Automatic Discovery & Mapping – Automatically detects and maps applications, services, and infrastructure components in real time.
Full Stack Observability – It allows you to see all your metrics, logs, your infrastructure, all of your applications and user experience in a single platform.
Cloud & Microservices Support – Supports modern architectures like microservices, containers, and hybrid cloud environments, making it easier to adopt cloud-native practices.
| Pros | Cons |
|---|---|
| AI‑driven root‑cause analysis for faster troubleshooting | Can be expensive for large environments |
| Automatic discovery of applications & infrastructure | Steeper learning curve for beginners |
| Excellent support for cloud, microservices & containers | Some advanced features may require extra modules |
| Unified observability with real‑time dashboards | Less flexible alert customization vs open‑source |
2. New Relic
New Relic offers a full-stack APM solution that monitors applications, infrastructure and digital experiences. Developers can get insight into performance metrics, error rates and transaction traces to resolve issues.
Developers can set real-time dashboards, and custom alerts to help teams maintain Sam systems using New Relic’s AI-assisted an anomaly detection.
New Relic works with many integrations and cloud environments and is great for organizations that to want optimize performance, minimize downtime, and enhance user experience.
Features New Relic
Distributed Tracing – Observes the entire journey of a request in a microservices ecosystem and identifies bottlenecks.
Real-Time Monitoring Dashboards – Provides real time tracking, error monitoring and analyzing dashboards.
AI Anomaly Detection – Machine learning is used to automatically detect and signal varying performance problems.
Extensive Integrations – Provides observability on many languages, frameworks, and clouds.
| Pros | Cons |
|---|---|
| Full‑stack observability across apps & infrastructure | Pricing can rise quickly with high data volume |
| Strong integrations with many cloud platforms | Dashboard and UI can feel cluttered |
| AI‑assisted anomaly detection & alerts | Historical data retention limited on cheaper plans |
| Easy setup with lots of out‑of‑the‑box features | Some users find navigation complex |
3. AppDynamics
Cisco’s AppDynamics provides APM features that cover the entire spectrum of application management, including real-time monitoring of applications, servers, and business transactions.
It captures detailed code-level metrics and detects anomalies, which accelerates root cause analysis. AppDynamics focuses on business-centric monitoring, connecting technical details with business performance.
Its monitoring and advanced analytics, coupled with cloud service integrations, simplify complexity and improve environments for both development and operations teams
Allowing them to optimize application performance, improve user experience, and ensure reliable digital services.
Features AppDynamics
Business Transaction Monitoring – Integrates performance metrics with valued business transactions to understand the correlation.
Code-Level Diagnostics – Analyzes specific execution pathways and pinpoint offending modules or individual functions.’
Real-Time Analytics – Provides insights into performance in real-time for timely issues identification and resolution.’
Hybrid Environment Support – Provides consistent monitoring across on-premises, cloud, and hybrid environments.’
| Pros | Cons |
|---|---|
| Deep business transaction and performance monitoring | Can be costly especially in large deployments |
| Real‑time code‑level diagnostics | Complex configuration & setup |
| Excellent for enterprise environments | Alert tuning needs manual effort |
| Supports cloud, hybrid & on‑premises monitoring | User interface less intuitive to new users |
4. Datadog
Datadog offers monitoring and APM for cloud apps, infrastructure, and logs. Along with performance metrics and analytics, it helps teams capture and address issues more efficiently.
Its machine learning alerts and custom dashboards provide proactive anomaly and bottleneck detection. Datadog integrates with many cloud platforms, containers, and microservices, making it best suited for today’s Devops.
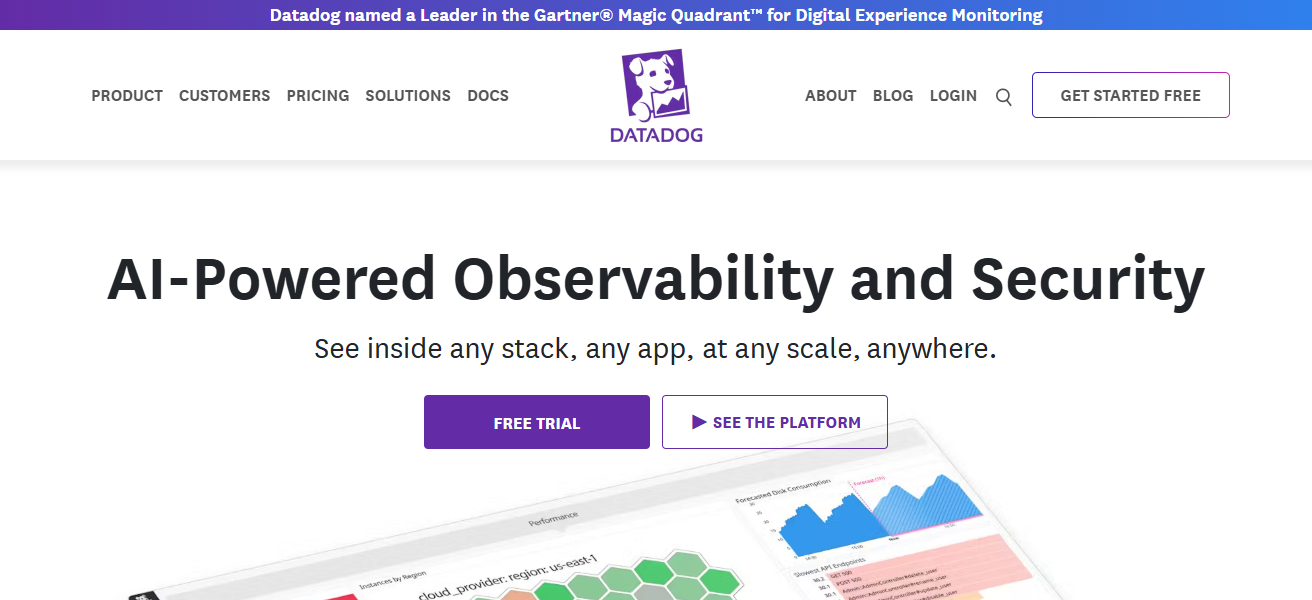
Datadog combines monitoring, analytics, and visualization which enables ops teams and devs to optimize performance, uptime, and overall user experience.
Features Datadog
Unified Monitoring Platform – Integrates logs, APM, infrastructure metrics, and security signals into a single pane view.
Distributed & Service Tracing – Obtains traces across services to detect and resolve slowdowns and failures in distributed systems.
Auto-Instrumentation – Automatically instruments a wide range of environments and minimizes the required prep work.
Customizable Dashboards – Provides customizable, user-friendly dashboards. Teams can configure them to display the performance metrics that are most important to them.
| Pros | Cons |
|---|---|
| Unified APM, logs, metrics, and traces | Costs can escalate with usage and modules |
| Strong support for containers & microservices | Data sampling may limit granularity |
| Fast deployment and auto‑instrumentation | Alert noise if not properly tuned |
| Excellent dashboards and integrations | Some features require extra paid modules |
5. Splunk APM
Splunk APM, an observability platform, helps businesses analyze application performance, infrastructure, and end-user behavior.
Using AI-powered analytics, Splunk APM identifies and analyzes anomalies, provides trace visualizations, and monitors critical metrics across various distributed systems.
The platform’s personalized alerts and flexible dashboards enable teams to identify and address performance issues promptly.
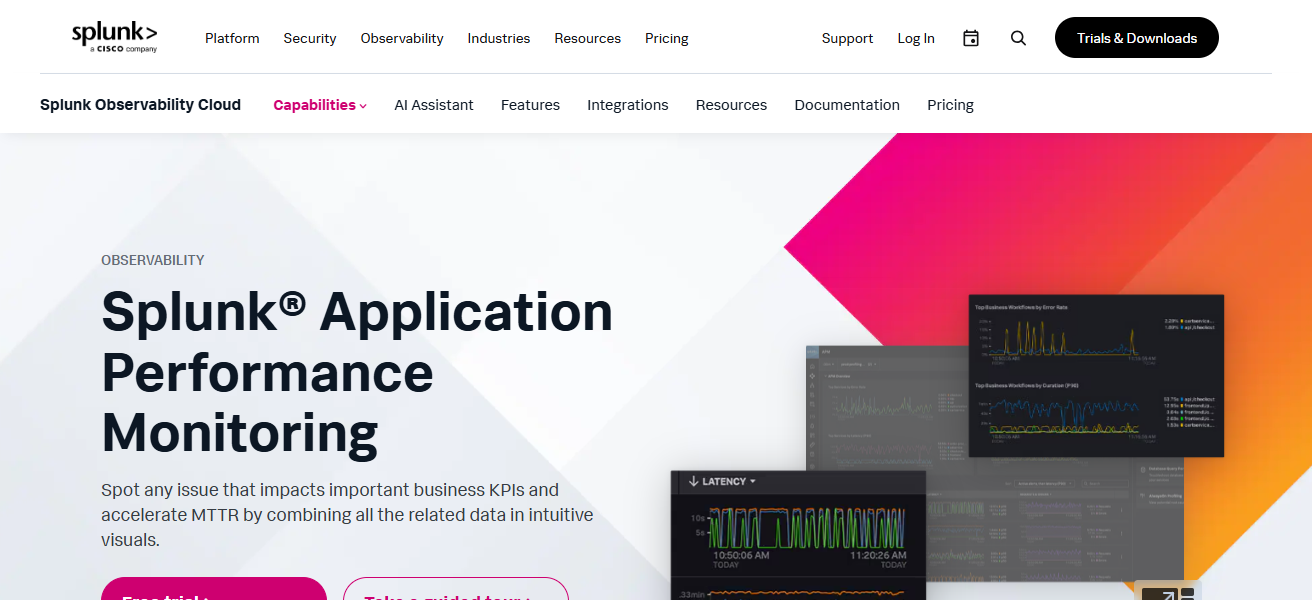
With full-stack observability, Splunk APM provides seamless integration with cloud platforms, microservices, and DevOps workflows.
By merging monitoring, analytics, and AI, Splunk APM empowers organizations to enhance digital experiences, improve reliability, and optimize performance.
Features Splunk APM
AI-Driven Performance Insights – Leverages machine learning to identify and anticipate performance issues.’
Trace & Log Correlation – Relates traces to logs and metrics to support quicker identification of root causes.
High Scalability – Tailored for large enterprises that rely on high volumes of data and large-scale environments.
Flexible Data Ingestion – Offers broad observability across the entire stack by integrating a diverse array of data sources.
| Pros | Cons |
|---|---|
| Strong AI‑based performance insights | High cost when combining logs & traces |
| Excellent correlation of logs, metrics & traces | Can be complex to set up |
| Scales well for enterprise systems | Dashboards can feel overwhelming |
| Works well with broader Splunk ecosystem | Advanced analysis needs configuration |
6. Elastic APM
Elastic APM forms a part of the Elastic Stack and offers robust monitoring and observability for applications and services.
It records performance metrics and transaction failures and traces transactions so that developers can understand and reduce the bottlenecks that impact performance.
Elastic APM is integrated with Elasticsearch and Kibana to help teams visualize application behavior and correlate the metrics with logs to identify the cause of the performance issue.
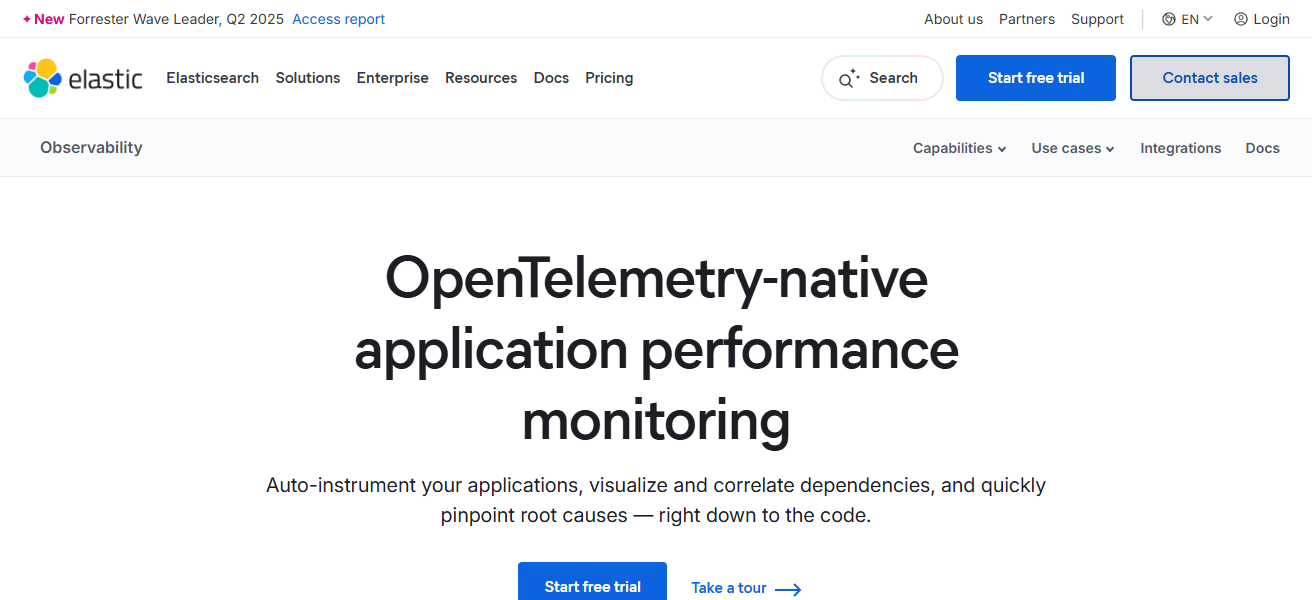
It works well for distributed and cloud-native environments and offers scalable and real-time insights.
The open-source analytics and alerting capabilities provide great value for cost-sensitive use cases for maintaining application performance.
Features Elastic APM
Open Setup – Elastic APM falls under the Elastic Stack, providing users the ability to customize options for self-hosting.
Log & Metric Association – In-depth APM analysis by blending APM data with logs and metrics within the Elastic’s search and analysis engine.
Distributed Tracing – Evaluates total transaction performance breakdown across all services and components.
Kibana Analysis – Kibana provides a way to view dashboards and analyze data over time.
| Pros | Cons |
|---|---|
| Open‑source flexibility with customization | Needs Elasticsearch skills to optimize |
| Cost‑effective compared to proprietary tools | Scaling requires careful resource planning |
| Great log + metric + trace correlation | Alerts & dashboards need manual setup |
| Integrates deeply with Kibana | UI less polished for beginners |
7. ManageEngine Applications Manager
ManageEngine Applications Manager provides APM and infrastructure monitoring for applications, databases, and servers.
The solution gives a clear picture of performance, availability, and resource utilization, helping teams identify and address bottlenecks.
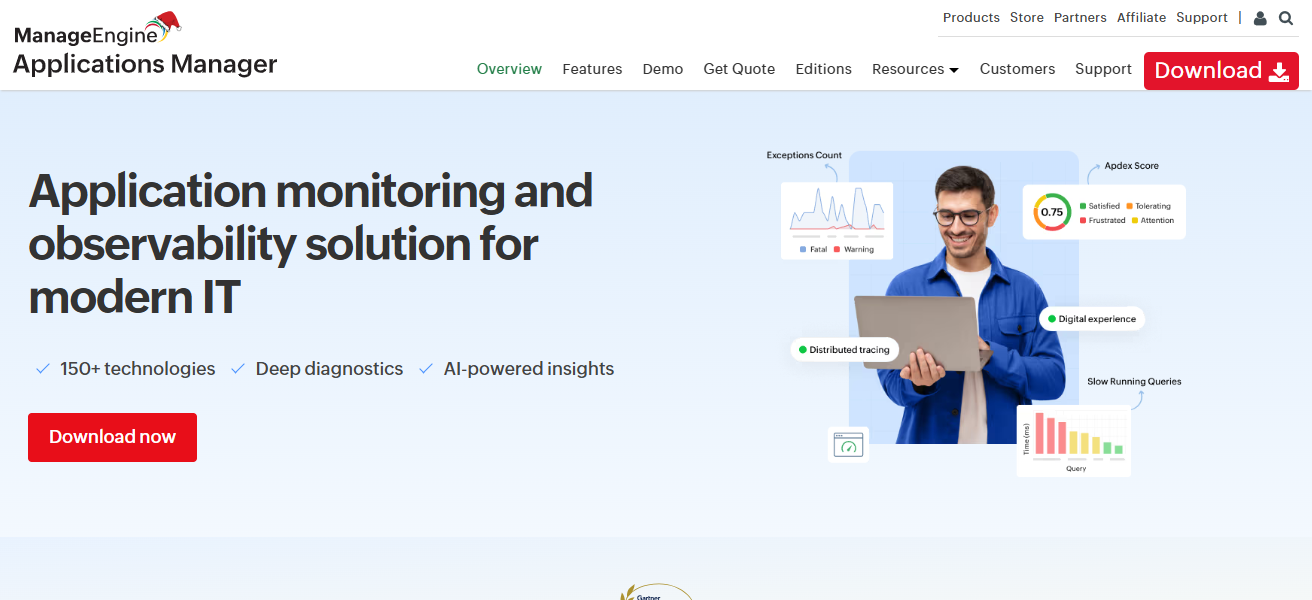
Troubleshooting is made quick and easy with dashboards and custom alerts. Clear cause analysis simplifies the process.
ManageEngine covers a broad range of monitoring options, including cloud services, virtual setups, and hybrid services.
End-to-end monitoring visibility helps organizations optimize application performance and improve operation stability, resulting in a smoother user experience and better business continuity.
Features ManageEngine Applications Manager
Holistic Monitoring – From one console, oversight of applications, servers, databases, and all facets of the infrastructure is available.
Performance Triggers – Proactive alerts when metrics breach a set performance target.
Root Cause Analysis – Offers insight and performance recommendations to identify the pertinent reasons for performance.
Hybrid Environment Capabilities – Able to manage monitoring of both the cloud and on-premise environments.
| Pros | Cons |
|---|---|
| Good value, especially for small/mid organizations | User interface feels dated |
| Broad monitoring across apps, servers & infra | Fewer advanced AI/ML insights |
| Easy setup and configuration | Cloud native support is limited |
| Strong alerting & root‑cause features | Reporting features are basic |
8. SolarWinds AppOptics
SolarWinds AppOptics provides a cloud based APM with extensive monitoring capabilities for applications, infrastructure, and microservices.
It offers performance metrics, anomaly detection, and tracing in distributed systems, allowing for rapid issue resolution.
Customizable alerts, easy to use dashboards, and integration with major cloud systems are features that enable efficient and scalable performance.
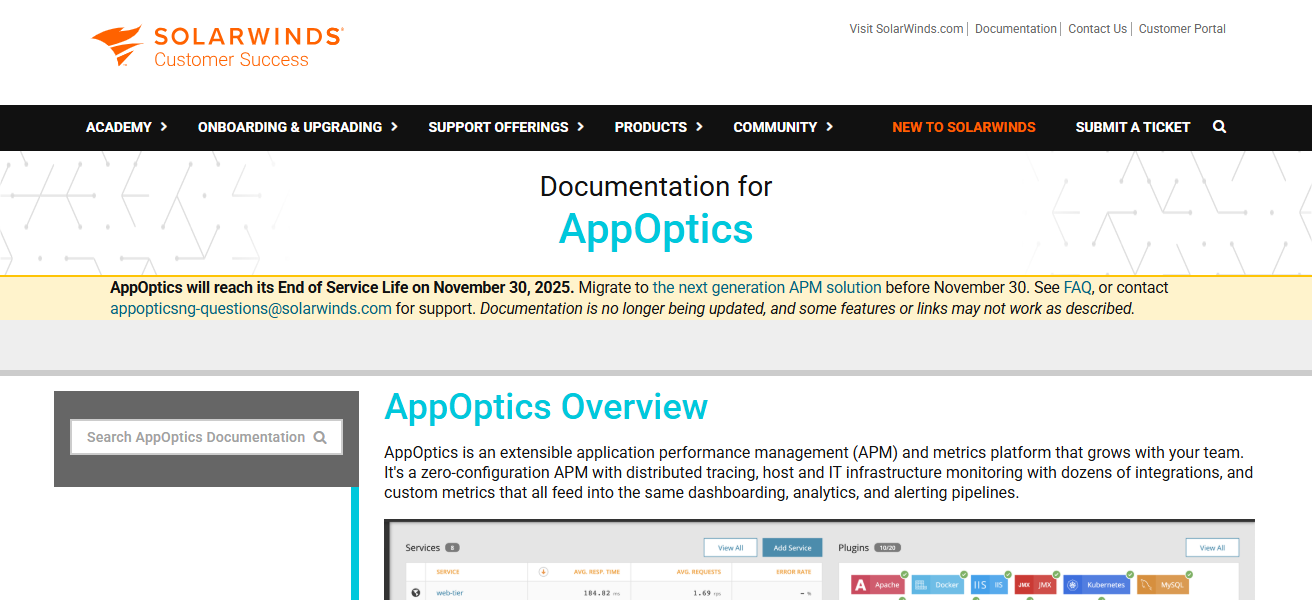
AppOptics provides observability simplicity to backend systems and developers, allowing for performance and user experience improvements, and downtime reductions. This is a great solution for companies both large and small.
Features SolarWinds AppOptics
Tracing & Metrics – Collection and tracing of performance metrics across all distributed systems.
Dashboards – Engaging dashboards that display important metrics on performance.
Monitoring for Containers & Cloud – Direct monitoring of cloud environments, virtual machines, and containers.
Integration Ecosystem – Compatible with major cloud, orchestration, and DevOps workflow tools.
| Pros | Cons |
|---|---|
| Simple, intuitive dashboards | Less deep analytics than enterprise APMs |
| Cost‑effective for small and medium teams | Alerting flexibility is limited |
| Good support for distributed tracing & metrics | Some users see sampling limitations |
| Easy integration with common cloud services | Smaller feature set than top competitors |
9. Instana
Instana’s APM solutions capture sophisticated microservices and containerized environments with the help of AI.
It provides automatic service discovery, real-time tracing, and insightful analysis, assisting teams in identifying and fixing performance problems.
Instana is able to streamline intricate monitoring system due to intelligent root cause analysis and dynamic visualizations.
Its effortlessly coupled systems with cloud technology, Kubernetes, and DevOps tools to provides persistent performance increasing.
The blending of automation, analytics, and observability, Instana empowers customers to achieve and sustain application high performance and less operational overhead.
Features Instana
Automatic Service Discovery — Identifies and maps services with no need for manual configuration.
Real-time Tracing — Offers real-time tracing for every request with little overhead.
Smart Alerts & Root Cause — AI logic is used to find and surface the most important alerts with their root cause.
Cloud-Native Optimization — Great for microservices, containers, and orchestrated environments such as Kubernetes.
| Pros | Cons |
|---|---|
| Automatic service & dependency mapping | Licensing and cost can be high |
| Real‑time tracing without manual config | UI may overwhelm non‑technical users |
| Great for cloud native & microservices | Custom dashboards need effort |
| Intelligent root cause analysis | Alert tuning still requires manual work |
10. Stackify Retrace
Stackify Retrace is a developer-centric application performance management (APM) solution with performance monitoring, error tracking, and log management at the code level.
It helps solve application problems with customizable problem detection and solution management, in addition to detailed transaction reports, an SQL query report, and proactive performance improvement reports.
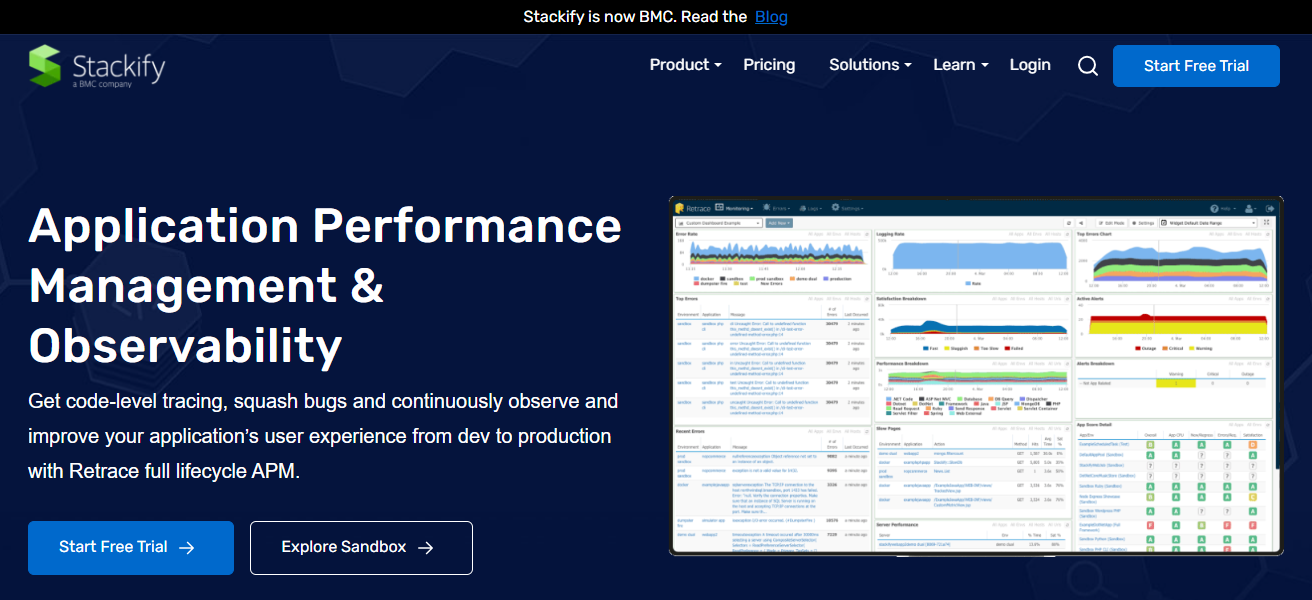
Retrace’s proactive reports help increase customer satisfaction and application performance. Its cloud service, framework, and DevOps integrations improve stack observability.
Stackify Retrace is the solution for efficient application management for developers and operations teams, as it combines metrics, logs, and traces to help create high-performance applications.
Features Stackify Retrace
Code-Level Performance Insights — Aims to find slow code paths, database calls, and bottlenecks in the application.
Error Tracking & Logging — Errors are captured with sufficient context and are linked to appropriate logs for quicker diagnosis.
APM & Log Integration — Application performance is integrated with logs and metrics in a single dashboard.
Developer-Friendly Tooling — Comes with a developer-oriented interface and workflows for easy and faster debugging.
| Pros | Cons |
|---|---|
| Developer‑focused with code‑level insights | Less rich infrastructure monitoring |
| Strong error tracking and logging | Limited hybrid cloud support |
| Easy to set up and use | Smaller AI/ML anomaly detection |
| Great integration for .NET and JVM applications | Fewer integrations than larger APMs |
How We Choose Best Application Performance Monitoring (APM) Software
Application & Environment Support – Check the APM’s environment support. Check their tech stack, cloud, microservices, containers, and hybrid support.
Auto-Instrumentation & Ease of Deployment – Tools with quicker setup and minimal manual configurations are best.
Analytics & Monitoring features – Try to see if they have distributed tracing, log correlation, code level diagnostics, dashboards and anomaly detection.
Scalability & Performance – Check how well the service deals with high traffic, a lot of services, and big data sets.
Root Cause Analysis & Alerting – Look for smart alerts, insights from AI, and rapid issue resolution.
Ecosystem & Integration – See how well it integrates with cloud services, DevOps, and custom plugins.
ROI & Pricing – Check the features, the data caps, and the overall business value against the price.
Support & User Experience – Look for helpful support, a smooth UI, reporting, and outstanding documentation.
Cocnlsuion
In cocnlsuion Selecting APM software is one of the most important factors in ensuring optimal application performance, less downtime, and an improved user experience.
Services such as Dynatrace, New Relic, AppDynamics, and Datadog deliver an all-inclusive package of monitoring, analytics and root-cause analysis.
Evaluating and weighing factor such as features, scalability, integrations, and cost allows organizations to choose the optimal solution in managing their most dependable and high performing applications in today’s cloud and hybrid environments.
FAQ
APM (Application Performance Monitoring) software helps track and optimize application performance, detect errors, and improve user experience.
It identifies bottlenecks, reduces downtime, improves efficiency, and ensures business transactions run smoothly.
Popular tools include Dynatrace, New Relic, AppDynamics, Datadog, Splunk APM, Elastic APM, ManageEngine Applications Manager, SolarWinds AppOptics, Instana, and Stackify Retrace.
Key features include distributed tracing, log correlation, code-level diagnostics, real-time dashboards, AI-based anomaly detection, and cloud support.
Cloud APM is easier to scale and maintain, while on-premise offers more control and may suit sensitive data environments.


