This article will talk about the best data analytics platforms for enterprises that aid and assist companies in the transformation of raw data into useful and actionable insights.
- Key Points & Best Data Analytics Platforms for Enterprises
- 10 Best Data Analytics Platforms for Enterprises
- 1. Microsoft Power BI
- 2. Tableau
- 3. Qlik Sense
- 4. Google BigQuery
- 5. IBM Cognos Analytics
- 6. SAP BusinessObjects
- 7. Amazon QuickSight
- 8. Oracle Analytics Cloud
- 9. SAS Visual Analytics
- 10. FineBI
- Cocnlsuion
- FAQ
These platforms associated with enterprises and companies assist in visualizing the trends and formulating data-based decisions. As a result, operational efficiency is enhanced.
We will talk about the most robust reporting tools and advanced AI analytics and will discuss the features, benefits, and key points of the best enterprise analytic solutions.
Key Points & Best Data Analytics Platforms for Enterprises
| Platform | Key Point |
|---|---|
| Microsoft Power BI | Seamless integration with Microsoft ecosystem for enterprises already using Office 365 and Azure |
| Tableau | Advanced data visualization capabilities with intuitive drag-and-drop dashboards |
| Qlik Sense | Associative data exploration enabling users to uncover hidden insights beyond linear queries |
| Google BigQuery | Serverless architecture that scales automatically for massive datasets |
| IBM Cognos Analytics | AI-driven insights that suggest visualizations and patterns automatically |
| SAP BusinessObjects | Enterprise-grade reporting with strong governance and compliance support |
| Amazon QuickSight | Pay-per-session pricing model that reduces costs for large organizations |
| Oracle Analytics Cloud | Embedded machine learning for predictive analytics within enterprise workflows |
| SAS Visual Analytics | Robust statistical modeling trusted for complex enterprise-level analysis |
| FineBI | Self-service BI empowering non-technical users to build dashboards independently |
10 Best Data Analytics Platforms for Enterprises
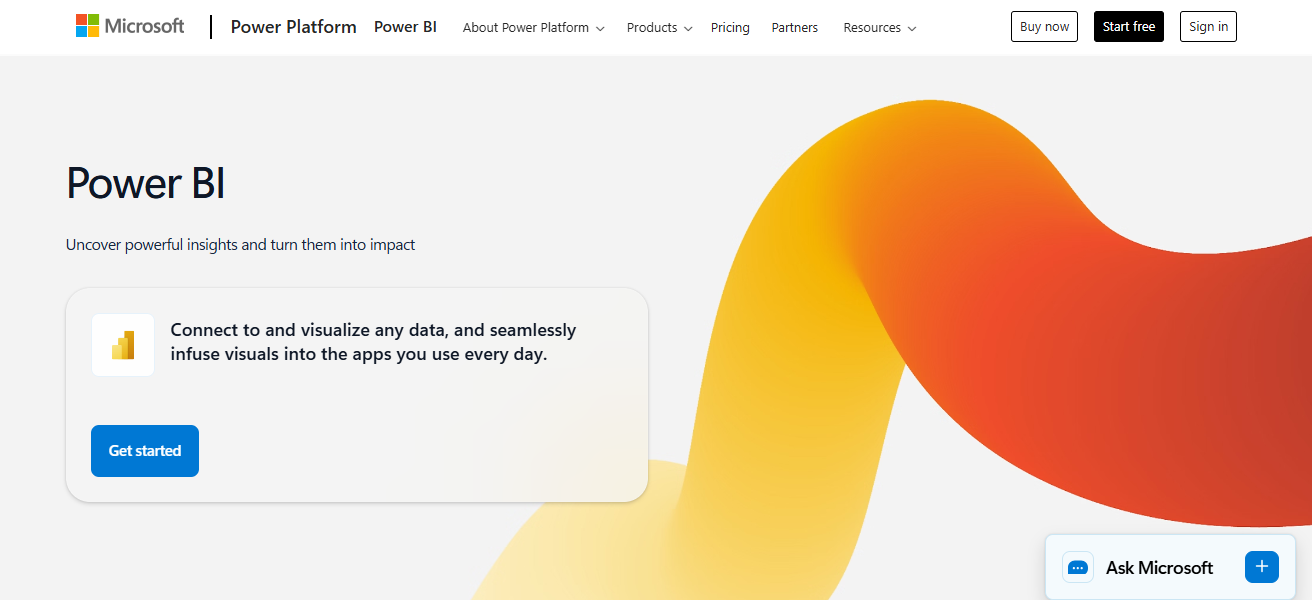
1. Microsoft Power BI
Microsoft Power BI is a multi-faceted data analytics tool designed for businesses of any size. It incorporates and presents data from Microsoft tools like Excel and Azure through interactive, customized dashboards.
Power BI allows and supports real-time data streaming, making analytics and decision-making faster and more accurate.
In addition to its functionality, Power BI offers a user-friendly interface that empowers individual users to securely share analytics and reporting across organizational silos.
Power BI is ideal for businesses that need to integrate and analyze from multiple data sources, and share and automate complex insights.
Features Microsoft Power BI
Interactive Dashboards: Business insights are portrayed in real time via dashboards.
Data Connectivity: Out of various data sources which are possible include Excel, SQL, and other azure cloud services.
AI and Analytics: Predictive data insights are provided by tools in machine learning and AI.
Collaboration: Role defined access lets you share your reports with different teams.
| Pros | Cons |
|---|---|
| Strong integration with Microsoft ecosystem (Excel, Azure). | Can be complex for non‑Microsoft environments. |
| Affordable licensing and flexible pricing. | Performance can slow with very large datasets. |
| Excellent visualization and real‑time dashboards. | Advanced analytics requires Power BI Premium. |
| Easy sharing and collaboration across teams. | Learning curve for advanced features. |
2. Tableau
Tableau is one of the top data visualization platforms as it is known for its simple, user-friendly, drag-and-drop interface.
Tableau helps companies visualize their data, create shareable dashboards, and requires minimal programming.
Tableau connects to various data sources and is able to perform analytics in real-time, creating more sophisticated visual stories.
Teams can leverage the AI and the collaborative tools of Tableau to analyze data, identify patterns, and make data-driven decisions.
Tableau is able to process large data sets which is one of the reasons why large companies all over the world have chosen Tableau.
Features Tableau
Advanced Visualizations: The industry’s leading chart types, and visual storytelling.
Self-Service Analytics: Users, without major assistance from IT, can explore data.
Data Source Variety: Integrates with cloud tools, spreadsheets, databases, etc.
Interactive Dashboards: Data can be dynamically filtered, drilled down, and explored.
| Pros | Cons |
|---|---|
| Industry‑leading visuals and interactive dashboards. | Higher cost than many competitors. |
| Connects to a wide range of data sources. | Requires training for advanced use. |
| Strong community and learning resources. | Server setup and management complexity. |
| Powerful self‑service analytics for users. | Limited built‑in predictive analytics. |
3. Qlik Sense
Qlik Sense offers self-service data visualizations combined with guided analytics. Being an enterprise analytics platform, Qlik Sense utilizes its unique associative data engine, edging the competition in the data analytics space, allowing for the free exploration of data relationships.
Qlik Sense also allows for real-time dashboards, predictive analytics, and multi-source data integration, making its customers’ data and the decisions around that data streamlined.
Users of the platform are businesses that are interested in the collaboration features that enable customers to create and share reports in a secure environment.
Qlik Sense makes data-driven decisions accessible to all employees across all functions to make the business more efficient, thanks to its automation features.
Features Qlik Sense
Associative Engine: Relationships between data points can be explored freely.
Smart Visualizations: Based on data patterns, charts can be suggested automatically.
Self-Service BI: Users in business can create coded-free reports.
Governed Data Access: Control and analytics are secured in a centralized manner.
| Pros | Cons |
|---|---|
| Associative engine allows natural data exploration. | Interface may feel less intuitive initially. |
| Good data integration capabilities. | Can require significant deployment effort. |
| Strong self‑service BI capabilities. | Licensing cost can be high for large teams. |
| Smart analytics and AI suggestions. | Performance depends on data modeling quality. |
4. Google BigQuery
BigQuery is a fully-managed, serverless data warehouse developed to handle extensive analytical workloads. This service offers enterprises the possibility to execute speedy SQL with no infrastructural management.
Integration with other Google Cloud Services and third-party applications makes data processing and visualization easy. Prediction and pattern recognition possible through integrated AI and machine learning.
For enterprises with a focus on big data, real-time processing, affordable storage, and extensive compliance and security capabilities make BigQuery the preferred data warehouse. Performance and scalability make BigQuery a premier choice for organizations.
Features Google BigQuery
Serverless Architecture: Scalability is automatic with a lack of infrastructure management.
Fast SQL Queries: Analytics can be performed on large data sets in seconds.
Built-In ML: Machine learning is directly integrated with workflows in SQL.
Cloud-Native: A seamless relationship with Google Cloud’s suite.
| Pros | Cons |
|---|---|
| Serverless architecture — no infrastructure to manage. | Costs can rise with heavy query usage. |
| Extremely fast SQL performance on big data. | Not a visualization tool — needs BI integration. |
| Built‑in ML & AI capabilities via SQL. | Query costs hard to forecast for some teams. |
| Scales elastically with data volume. | Requires cloud expertise to optimize. |
5. IBM Cognos Analytics
Cognos Analytics is an all-inclusive business analytics suite that provides various services, such as AI-driven reporting, data visualization, and reporting. Enterprises can automate report creation, build dashboards, and analyze large datasets.
Cognos connects with various data sources and provides advanced, predictive analytics. The platform uses AI to aid data preparation, helping address queries that are phrased in natural language, making it easier for those without a technical background to analyze the data.
Cognos Analytics provides the ability for organizations to make data-driven decisions, improve processes, and better manage planning across a wide array of business areas.
Features IBM Cognos Analytics
AI-Assisted Insights: Get recommendations based on your question in natural language.
Enterprise Reporting: Provides scheduled reporting in large format for an entire organization.
Dashboarding: Stakeholders can leverage interactivity in their analytic views.
Data Governance: Significant compliance and security controls.
| Pros | Cons |
|---|---|
| Robust enterprise reporting and governance. | UI can feel dated compared with modern tools. |
| AI‑assisted data preparation and insights. | Implementation complexity for large orgs. |
| Strong security and compliance features. | Learning curve for full feature use. |
| Good for governed enterprise deployments. | Custom visualizations are limited. |
6. SAP BusinessObjects
SAP BusinessObjects is an analytical and reporting system focused on enterprises. It allows companies to prepare comprehensive reports and to design interactive dashboards and visualizations of data from different sources.
It also helps organizations meet governance and security mandates and make safe decisions. It provides predictive analytics and real-time insights and integrates with other SAP products like SAP HANA to provide analytics across an entire enterprise.
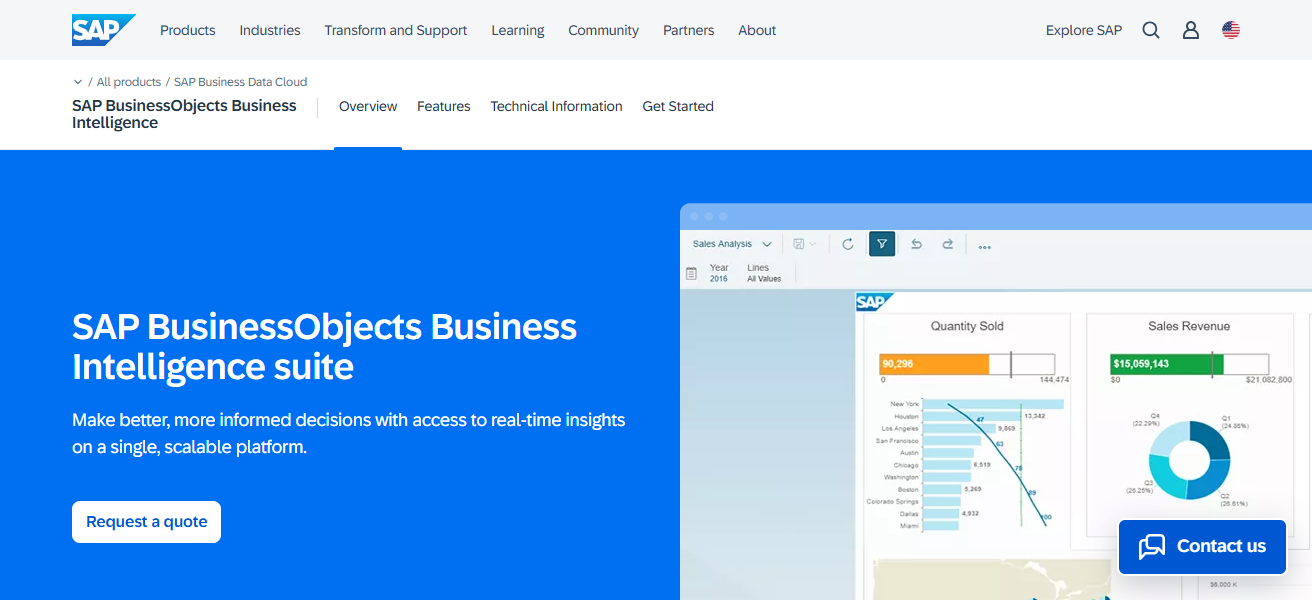
It is highly scalable and customizable, making it a perfect fit for large organizations that need centralized, curated, and genuine business intelligence.
Features SAP BusinessObjects
Enterprise Reporting: Provides high-fidelity reporting to ensure that your outputs are standardized to needed levels.
Data Integration: Performs well with SAP as well as non-SAP systems.
High Governance: Access control and auditing with changed visibility.
Scalable Architecture: Caters to large scale enterprises.
| Pros | Cons |
|---|---|
| Deep integration with SAP enterprise systems. | Complex deployment and administration. |
| Strong report generation and scheduling. | Not ideal for self‑service analytics. |
| High data governance and security. | UI feels older compared with newer platforms. |
| Good for structured enterprise BI. | Limited modern visualization options. |
7. Amazon QuickSight
Accessible through the web, Amazon QuickSight is a highly adaptable and rapidly scalable business intelligence platform. It provides companies with the most interactive dashboarding functionality and is able to visualize and generate analytical business insights from numerous data sources.
Built as a cloud application, QuickSight is able to use all the AWS resources and, thus, provides a serverless architecture, machine learning-derived insights, and the ability to automatically scale to any size dataset.
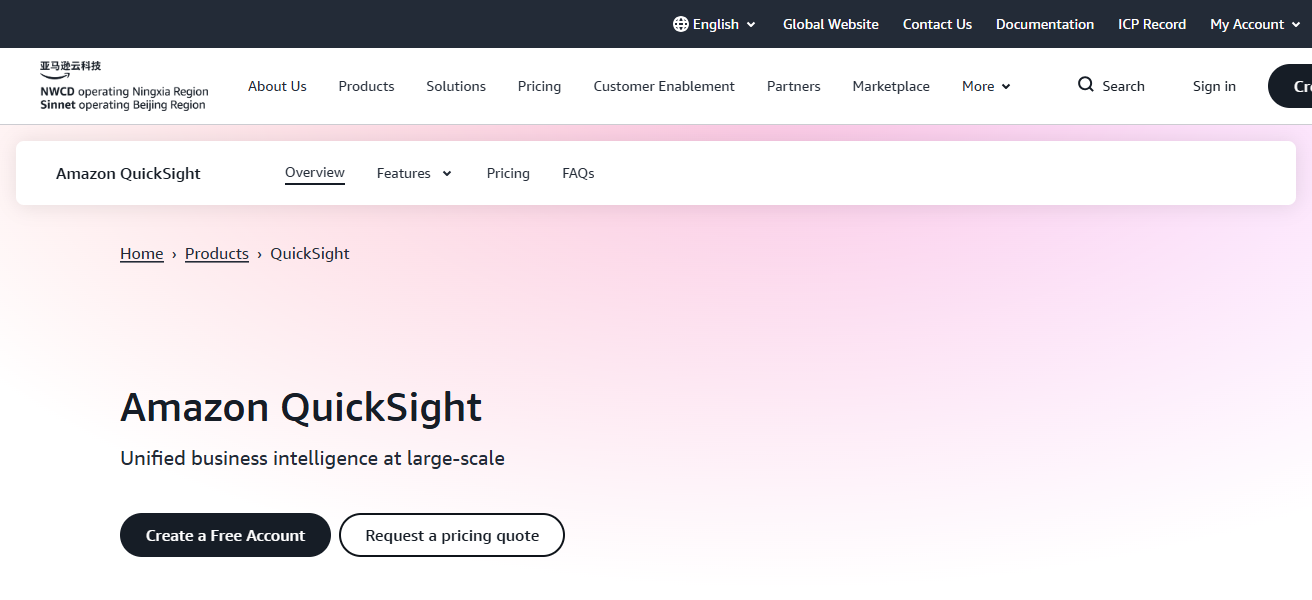
It offers real-time analytics and easy to set up, secure data sharing, providing organizations with an affordable analytical tool.
With its close to seamless integration with the numerous services offered by AWS, QuickSight offers companies a solution to monitor data, facilitate better informed decision making, and democratize analytical capabilities across their organizations.
Features Amazon QuickSight
Serverless BI: Autoscaling within AWS without any infrastructure burden.
Pay-Per-Session: Overall economical for large user bases.
ML Insights: Forecasting and anomaly detection intelligence via machine learning.
AWS Integration: Great connectivity with Redshift, S3, RDS, etc.
| Pros | Cons |
|---|---|
| Serverless and highly scalable on AWS. | Visualization features are more basic. |
| Pay‑per‑session pricing can reduce costs. | Less powerful than niche BI competitors. |
| Easy AWS integration (Redshift, S3, RDS). | Requires AWS expertise. |
| ML insights and natural language querying. | Limited offline and mobile features. |
8. Oracle Analytics Cloud
Oracle Analytics Cloud is an enterprise-level analytics solution that integrates business intelligence, data visualization, and AI insights. Users can prep, examine, and glean insights from myriad data sources.
It offers advanced predictive analytics, interactive dashboards, and query-by-voice features. Integration with Oracle Cloud infrastructure and enterprise applications offers built-in data security and reliability.
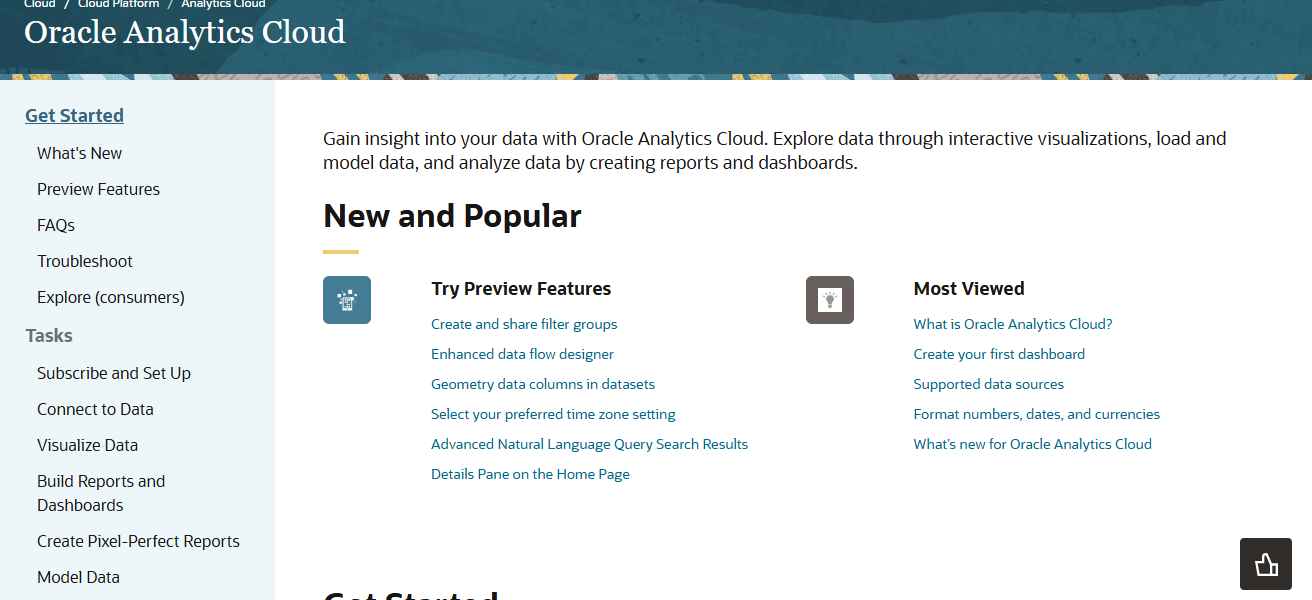
It is fully extensible and adaptable, allowing organizations to implement a centralized analytics framework to streamline business processes and promote an analytics culture at all levels.
Features Oracle Analytics Cloud
Comprehensive BI: Offers dashboards, visualizations, and predictive analysis within one solution.
AI & Natural Language: Get insights by answering questions in everyday language.
Cloud & On-Prem Support: Supports flexible deployments.
Secure Enterprise Platform: Has governance and user control by default.
| Pros | Cons |
|---|---|
| Enterprise‑grade analytics and security. | Pricing and licensing can be complex. |
| Strong integration with Oracle Ecosystem. | Setup & tuning needs expert administrators. |
| AI‑driven insights and natural language support. | User experience can be overwhelming. |
| Scalable and flexible cloud deployment. | Customization requires training. |
9. SAS Visual Analytics
SAS Visual Analytics is an excellent platform for large enterprises to examine large data sets. In addition to interactive dashboards and advanced machine learning reporting, the platform provides tools for predictive reporting.
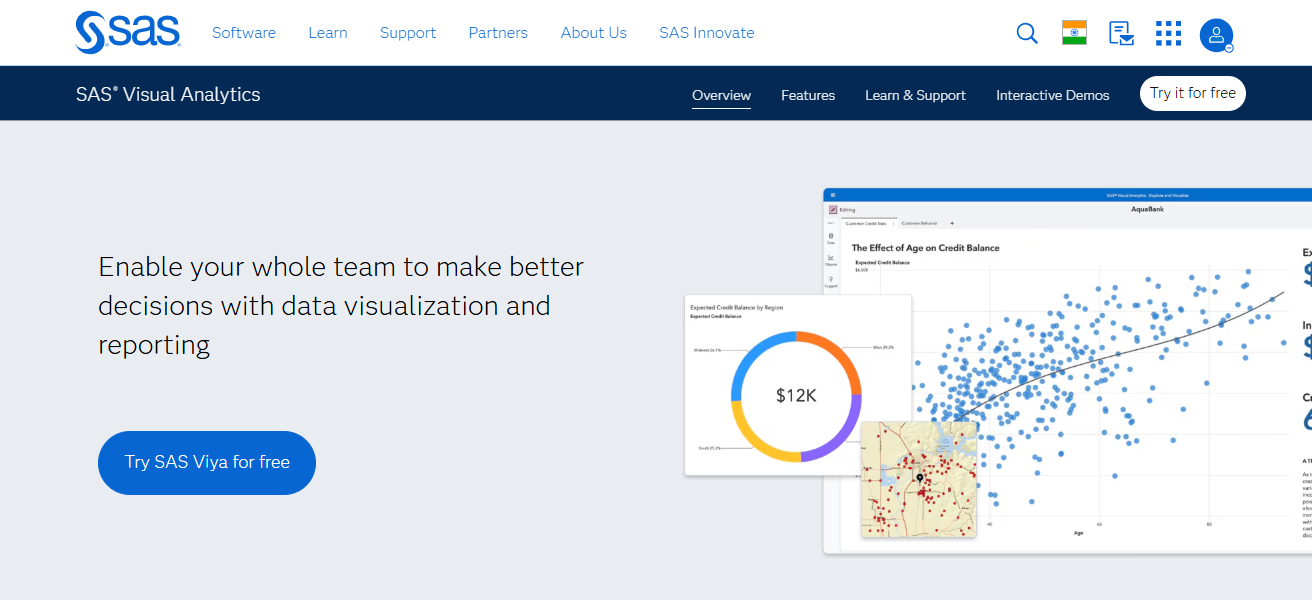
The platform’s advanced reporting tools assist organizations in data integration, providing automated trends and patterns. With advanced data security, SAS Visual Analytics is designed specifically for large enterprises and ensures compliance.
The platform is designed for organizations that need advanced analytical tools to support data-driven decision making.
Features SAS Visual Analytics
Advanced Analytics: Offers strong competence in predictive and statistical analysis.
Interactive Dashboards: Easily create and customize reports using visual drag-and-drop features.
Data Preparation: Automated tools for data cleaning and structuring.
Scalability: Supports high performance across multiple large datasets.
| Pros | Cons |
|---|---|
| Powerful advanced analytics and predictive modeling. | Higher cost compared with many BI tools. |
| Excellent for statistical analysis. | Steeper learning curve for business users. |
| Strong data governance and reliability. | Interface less intuitive than modern competitors. |
| Scales well for large enterprise datasets. | Deployment can be resource‑intensive. |
10. FineBI
FineBI is a business intelligence platform that is user friendly and flexible. Businesses can join a multitude of data sources to build dashboards and interactive reports.
One efficiency FineBI advocates is self-service analytics to allow business users access to data without IT assistance.
FineBI is a good fit for medium to large enterprises due to its lightweight structure and rapid analysis and visualization of data.
Because of its affordable integration options and collaborative capabilities, FineBI enables businesses to act quickly and accurately.
Features FineBI
Self‐Service BI: Users can create reports without needing IT assistance.
Fast Query Engine: Rapid data access and retrieval for instantaneous analytics.
Data Source Support: Integrates with different databases, flat files, and cloud storage.
Cost‐Effective: Low cost for small and medium businesses.
| Pros | Cons |
|---|---|
| Easy self‑service analytics and reporting. | Smaller ecosystem vs major brands. |
| Fast query performance. | Limited advanced analytics features. |
| Connects to many data sources. | Community support is less extensive. |
| Cost‑effective for SMB and mid‑enterprise. | Less recognized globally than peers. |
Cocnlsuion
In closing, the Numerous Data Analytics Platforms for Enterprises enable organizations to streamline complex data into impactful insights, improved decision making, and subsequent growth in the business.
These enterprsae r organizations to diversify their needs with the use of interactive dashboards, predictive analytics, and seamless cloud integration.
These solutions allow companies to automate their processes, improve teamwork, and gain a solid competitive edge in a world driven by data.
FAQ
A data analytics platform is software that helps enterprises collect, process, visualize, and analyze data to make informed business decisions.
They provide insights, improve decision-making, enhance efficiency, and uncover trends that drive growth and competitiveness.
Tableau and Microsoft Power BI are top choices due to interactive dashboards and rich visualization options.
Google BigQuery and Amazon QuickSight excel at handling massive datasets with high-speed querying and cloud scalability.
Yes, platforms like SAS Visual Analytics, IBM Cognos, and Oracle Analytics Cloud provide AI-driven and predictive analytics features.