In This Post I will Talk About Best Forex Indicators to Combine with AI Predictions to use with forex AI predictions to facilitate better trading decisions.
- Key Points & Best Forex Indicators to Combine with AI Predictions List
- 10 Best Forex Indicators to Combine with AI Predictions
- 1.Moving Averages (MA)
- 2.Relative Strength Index (RSI)
- 3.Bollinger Bands
- 4.MACD (Moving Average Convergence Divergence)
- 5. Fibonacci Retracement
- 6.Stochastic Oscillator
- 7.Ichimoku cloud
- 8.Volume Profile
- 9.ADX (Average Directional Index)
- 10.Pivot Points
- Conclusion
RSI, MACD, and Ichimoku Cloud are AI’s proven technical tools which when utilized together will improve accuracy in predictions, trend detection, timing, and overall give more power to trade in the regions forex traders work.
Key Points & Best Forex Indicators to Combine with AI Predictions List
| Indicator | Key Point |
|---|---|
| Moving Averages (MA) | Smooths price data to identify trends over time. |
| Relative Strength Index (RSI) | Measures momentum; overbought above 70, oversold below 30. |
| Bollinger Bands | Uses standard deviation to show volatility and potential breakout zones. |
| MACD | Tracks trend changes using EMA crossovers and histogram divergence. |
| Fibonacci Retracement | Identifies potential support/resistance using Fibonacci ratios. |
| Stochastic Oscillator | Compares closing price to price range to find overbought/oversold signals. |
| Ichimoku Cloud | Multi-faceted trend system showing support, resistance, and momentum. |
| Volume Profile | Shows volume traded at specific price levels to highlight key zones. |
| ADX | Measures trend strength; above 25 = strong trend, below = weak trend. |
| Pivot Points | Predicts support and resistance based on previous price action. |
10 Best Forex Indicators to Combine with AI Predictions
1.Moving Averages (MA)
Moving Averages (MA) are primary for smoothing out fluctuations in price data as they assist in estimating the strength and direction of underlying trends. With the assistance of AI, MAs can serve as a foundational framework supporting price forecasts.
AI should be able to analyze crossovers better — like the one between the 50-day and the 200-day moving averages — because they learn how to identify patterns that historically precede shifts in the price. Moreover, MAs reduce noise and allow AI systems to detect signals that propel the market.
| Feature | Description |
|---|---|
| Simple & Exponential MAs | SMA averages over a period; EMA gives more weight to recent prices. |
| Trend Identification | Helps determine bullish or bearish market trends. |
| Crossover Signals | Golden Cross and Death Cross indicate buy/sell signals. |
| Noise Reduction | Smooths out short-term volatility for clearer analysis. |
2.Relative Strength Index (RSI)
RSI is designed to measure the rate of price movements, establishing if a currency is oversold or overbought. The RSI can be enhanced by AI through the moderation of thresholds of overbought oversold levels that respond to real-time volatility and sentiment analysis.
Instead of remaining static at 70/30, AI could provide more context-aware insights by adjusting these levels using 70/30 ranges that are utilized traditionally.
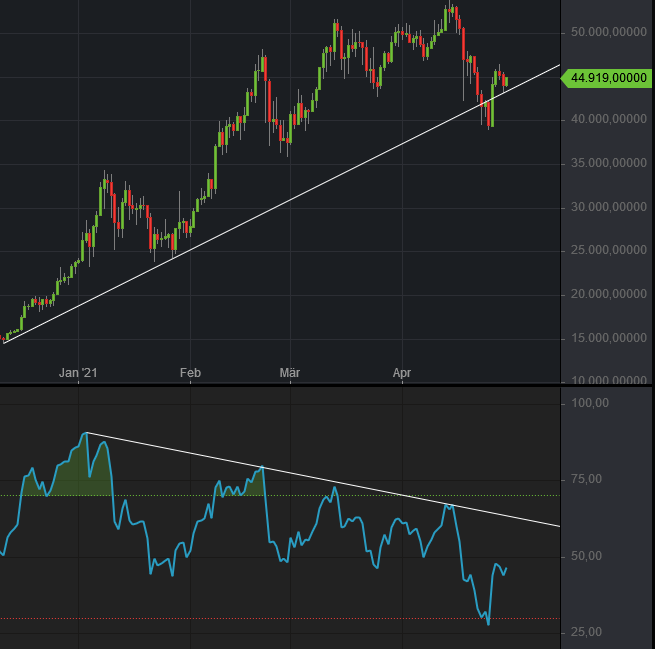
Additionally, AI can use new detection techniques for divergence patterns—areas where price moves opposite trends relative to RSI—before conventional methods identify them.
This, alongside augmentation offered by sophisticated systems, positions AI to strategically use RSI information to help make critical decisions pinpointing potential reversals alongside defining exit and entry strategies with increased accuracy.
| Feature | Description |
|---|---|
| Momentum Indicator | Measures speed of price changes over time. |
| Overbought/Oversold Zones | Typically above 70 (overbought) or below 30 (oversold). |
| Divergence Detection | Identifies potential reversals when RSI diverges from price action. |
| Customizable Thresholds | Levels can be adjusted depending on market conditions. |
3.Bollinger Bands
Bollinger Bands uses moving averages to define volatility and auction price extremes with standard deviations. AI takes these bands beyond simple visual aids as it has the ability to interpret band squeezes (low volatility) and expansions (high volatility) in real-time and predict probable price breakouts.
Moreover, AI can assess the reliability of band touches against set historical price movement contexts across different regimes, dynamically optimizing the band gap.
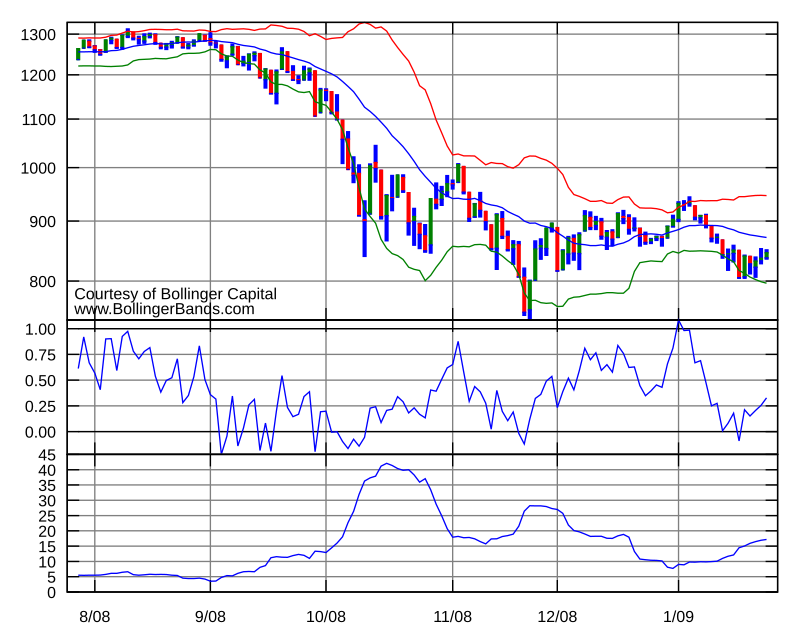
AI also assesses optimizing gap widths and period setting dynamically to evolving conditions in the market. This augments decision making and could help traders using volatility-based strategies.
| Feature | Description |
|---|---|
| Volatility Indicator | Bands expand/contract with market volatility. |
| Mean Reversion Signals | Price touching outer bands may suggest reversal toward the mean. |
| Band Squeeze | Indicates potential breakout or breakdown. |
| Adaptive to Market | Automatically adjusts to changing market conditions. |
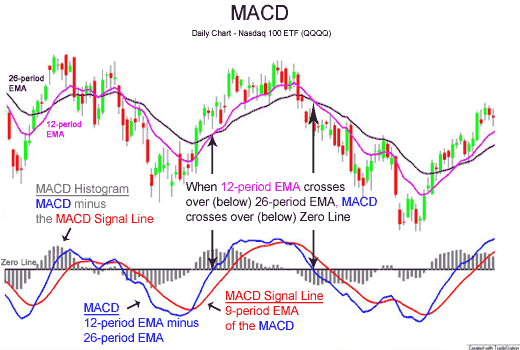
4.MACD (Moving Average Convergence Divergence)
Moving Average Convergence Divergence is MACD for short and is known as a trend-following momentum indicator that employs EMAs to identify trend shifts. It comprises of the MACD line, the signal line, and the histogram. AI technology augments MACD efficiency even more.
Based on historical data, AI can evaluate the crossovers and divergence patterns of MACD and improve signal accuracy by identifying and eliminating false signals using wider market information.
AI would also be capable of automatically optimizing the period of EMAs for different currency pairs and time frames. This allows traders to issuer position cases on customized and backtested momentum signals, which works well with AI’s capabilities in detecting intricate non-linear relationships.
| Feature | Description |
|---|---|
| Trend & Momentum Tool | Combines moving averages to assess trend strength and direction. |
| MACD & Signal Line Cross | Indicates bullish/bearish signals. |
| Histogram for Momentum | Visual representation of divergence between MACD and Signal line. |
| Customizable Periods | EMA periods can be adjusted for different market styles. |
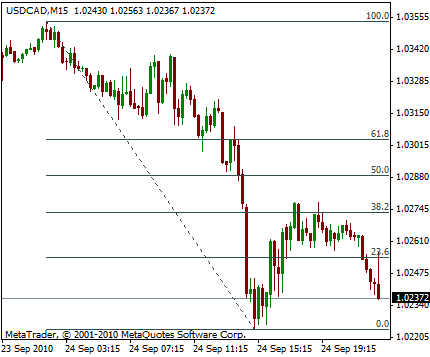
5. Fibonacci Retracement
Fibonacci retracement levels indicate possible zones for support and resistance with the use of the key ratios (23.6%, 38.2%, 61.8%) relative to price fluctuations.
These levels could just be static estimations but with AI integration they can transcend that. AI can enhance the precision by recalibrating both the initiation and termination points of the retracement.
It could also assess the degree of reliability of various Fibonacci levels using historical data as well as the prevailing market trends.
Such an integration of machine learning with Fibonacci analysis enables traders to bet on the movement of price at given levels with higher certainty, especially when combined with volume and candlestick patterns.
| Feature | Description |
|---|---|
| Key Levels: 38.2%, 50%, 61.8% | Common retracement levels for predicting pullbacks. |
| Support & Resistance Zones | Helps identify reversal points in trends. |
| Works on All Timeframes | Suitable for scalping, swing, and long-term trading. |
| AI-Enhanced Anchoring | Starting/ending points can be optimized via AI for better accuracy. |
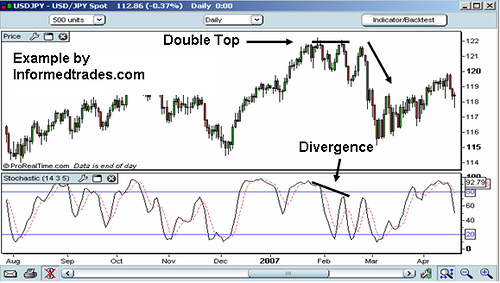
6.Stochastic Oscillator
The Stochastic Oscillator analyzes whether the closing price of a currency is at the upper or lower end of a specified range with respect to its closing high and low, indicating the possibility of being overbought or under bought.
AI can enhance its use by evaluating how effective the oscillator is with different pairs of currencies and calibrating its responsiveness. AI, for example, can adjust dynamically when it senses that the conventional 80/20 levels are too rigid.
AI can also detect hidden divergences that many times foreshadow great moves in the market. The employment of stochastic data along with AI offers much more refinement for market timing as well as filtering out false signals that arise from noise.
| Feature | Description |
|---|---|
| Overbought/Oversold Levels | Indicates potential reversal when above 80 or below 20. |
| %K and %D Lines | %K is faster, %D is a signal line. |
| Divergence Patterns | Detects price-RSI mismatches for early reversal signals. |
| Momentum Based | Tracks pace of price movement in recent candles. |
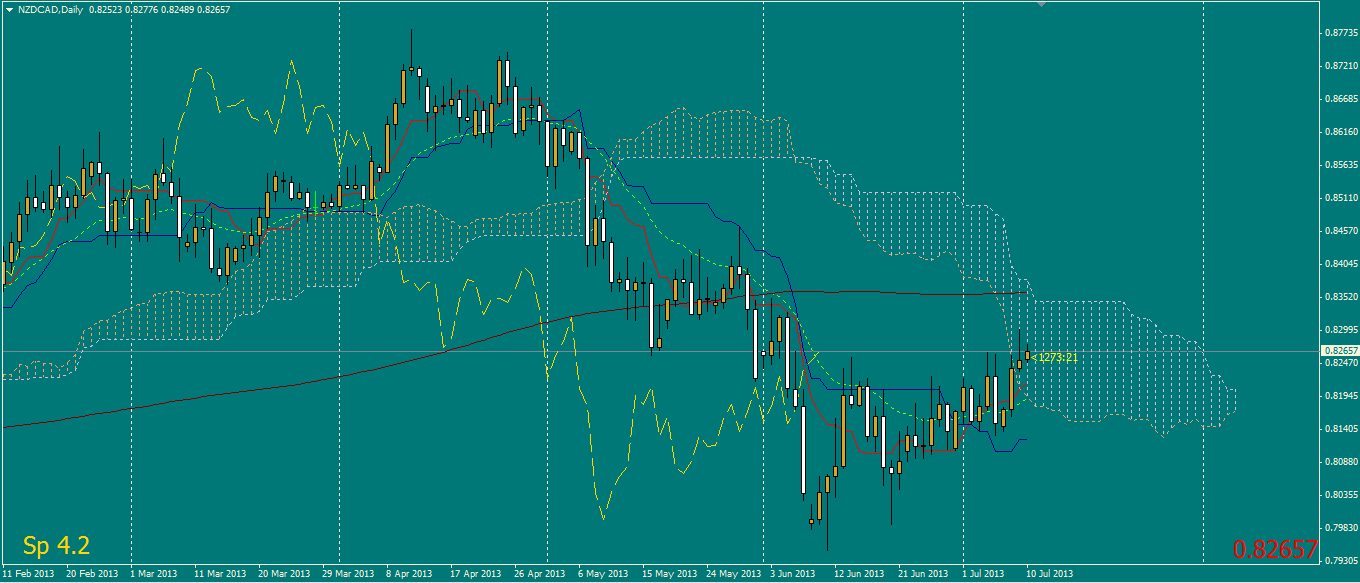
7.Ichimoku cloud
Ichimoku cloud This is a comprehensive technical analysis indicator that consolidates information about the direction of the trend, momentary support and resistance levels along with other market momentum. It consists of Tenkan-sen, Kijun-sen, Senkou Span A, Senkou Span B, Chikou Span.
Ichimoku cloud serves as a more advanced version of trade assistance AI by enabling an AI to understand how these different components would interact and determining rather accurately if the trend would continue or change.
It can customize different time-shifting elements for different markets. Through machine learning, the model also becomes more intelligent, determining how thick a cloud gets historically and making the ichimoku cloud more predictive, providing richer confirma artificial intelligence signals for Forex strategies to act on.
| Feature | Description |
|---|---|
| Multi-Component System | Includes Tenkan, Kijun, Senkou Spans, and Chikou Span. |
| Cloud Span (Kumo) | Represents support/resistance and trend strength. |
| Leading Indicators | Future-projected components give early signals. |
| Trend Clarity | Quickly shows trend direction and strength visually. |
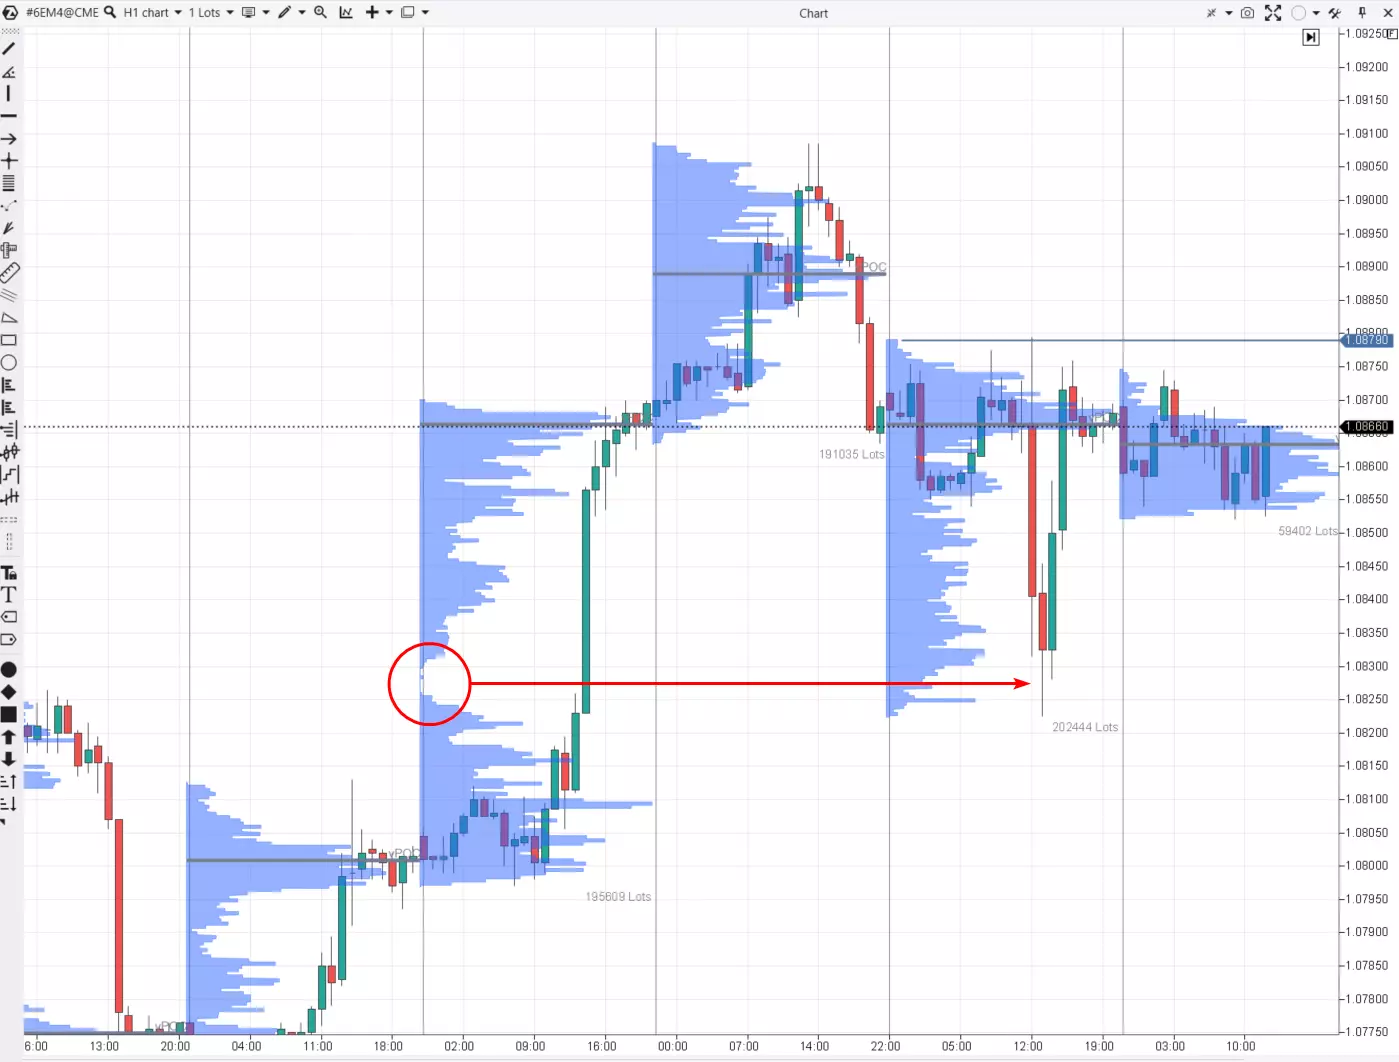
8.Volume Profile
The Volume Profile displays how trading volume is distributed along various price levels by marking activity zones of interest.
Unlike basic volume indicators, Volume Profile indicates where market participants are betting. Patterns that AI recognizes from historical data could improve this approach, especially when analyzing volume accumulation and distribution.
AI can also correlate volume data with price action of the stock or market to find undiscovered support/resistance levels and accurately detect breakout zones.
Machine learning algorithms can enhance real-time adjustments of volume profiles by eliminating outliers and determining key volume levels where significant trading activity occurs by institutions.
| Feature | Description |
|---|---|
| Price-by-Volume Display | Shows where most trading occurred at different price levels. |
| Value Area Identification | Highlights zones where 70% of volume occurred. |
| Point of Control (POC) | Level with the highest volume—often acts as a magnet. |
| Market Sentiment Insight | Reveals institutional interest and accumulation/distribution. |
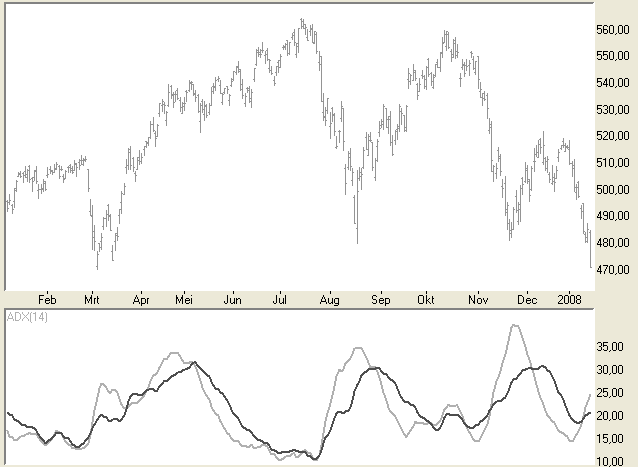
9.ADX (Average Directional Index)
ADX defines how strongly active a price trend for an asset is without defining its inline direction. A value above 25 indicates a strong trend; lower than that indicates lesser momentum.
AI can optimize sensitivity on the ADX and adjust reading relative to the prevailing market volatility, sentiment, and tracked history of results.
It can also assess the impact of DI+ and DI- crossovers under other conditions and their fluctuations, ignoring noise.
In an AI managed system, ADX integration gives traders ability to manage possibility of following trending moves or resisting one in ranged and uncertain conditions.
| Feature | Description |
|---|---|
| Trend Strength Indicator | Values above 25 suggest strong trend; below 20, weak/no trend. |
| Directionless Measurement | Only measures strength, not direction. |
| +DI and -DI Lines | Show trend direction (up or down). |
| Useful in Filtering Trades | Helps avoid range-bound or non-trending conditions. |
10.Pivot Points
With respect to the preceding period’s sessions, Pivot Points predicts subsequent support and resistance based on the prior period’s high, low, and closing prices. When AI is applied, Pivot Points start to function within a real-time adaptable system.

AI is able to assess how effective each pivot level has historically been and alter the formulas based on the instruments volatility or macroeconomic circumstances.
It can also use real-time order book information and sentiment news to predict whether price will obey or cross these levels. Thus, for day and swing traders, Pivot Points offer a reliable AI-supported analysis tool.
| Feature | Description |
|---|---|
| Intraday Price Levels | Predicts daily support/resistance using prior high, low, close. |
| Multiple Levels (S1, R1…) | Gives layered view of potential reversal or breakout points. |
| Widely Used by Day Traders | Popular in forex, stocks, and commodities for short-term trading. |
| Easily Calculated | Simple math makes it fast to use and automate. |
Conclusion
In conclusion, accuracy, timing, and adaptability with trading all improve when AI predictions are fused with forex indicators. AI technology improves the parameters and removes the literal “noise” of indicators such as RSI, MACD, and Ichimoku Cloud.
This allows traders to, smarter than ever before, make more informed decisions in times of high volatility so doing so makes them room to maximize their potential profits while minimizing risks. It’s undoubtedly the future of forex trading.