In this article, I will explore the Best Websites for Turning Blog Posts Into Infographics, enabling you to convert dense articles into captivating narratives visually.
I understand whether you are a blogger, a marketer, or an educator, the tools discussed here will assist you in elevating your design level, enhancing the attractiveness of your content, and increasing its shareability.
Find the ideal infographic maker among your requirements from the simplest DIY sites for novices to sophisticated data visualization tools.
Key Points & Best Websites For Turning Blog Posts Into Infographics List
| Website | Key Points |
|---|---|
| Canva | Drag-and-drop editor, infographic templates, free & premium versions. |
| Piktochart | Designed specifically for infographics, charts, and visual storytelling. |
| Visme | Offers animation, interactivity, and diverse infographic templates. |
| Venngage | User-friendly, great for non-designers, offers business-focused templates. |
| Adobe Express | Professional design tools with infographic templates and branding options. |
| Easel.ly | Simple, beginner-friendly, with customizable templates. |
| Infogram | Focus on data visualization with charts and real-time data import. |
| Snappa | Quick designs with pre-made infographic sizes and templates. |
| Animaker | Converts blog content into animated infographic videos. |
| Mind the Graph | Science-focused infographics for academic or technical content. |
10 Best Websites For Turning Blog Posts Into Infographics
1.Canva
Infographics can now be created simpler than ever at canva.com. Canva provides extensive templates for different categories enabling you to summarize key takeaways of your articles visually. Blog infographics can be crafted with drag-and-drop simplicity.
Your designs can be transformed into shareable infographics with the use of fonts, and even charts. With canva.com, you can share and download your designs in whatever format you would love. Sharing designs is made simple.
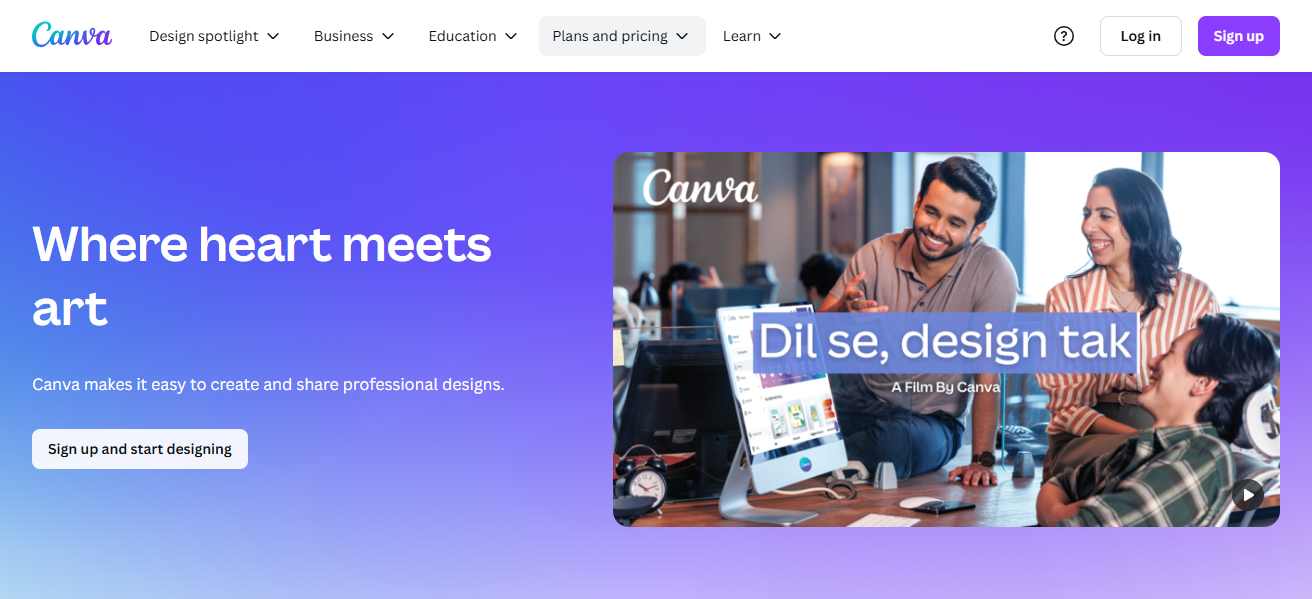
The free package has good features, and the Pro provides access to brand kits and graphics, enabling enhanced drawing and resizing. Marketers, and educators can now use canva and create visually appealing infographics.
| Feature | Description |
|---|---|
| Drag-and-Drop Editor | Easy-to-use interface with drag-and-drop capability |
| Pre-made Templates | Thousands of infographic templates for any topic |
| Brand Kit Support | Maintain consistent branding with fonts and logos |
| Stock Photos & Icons | Access to millions of images and design elements |
| Collaboration Tools | Invite team members to edit and comment in real time |
| Export Options | Download in PNG, JPG, PDF, and more formats |
2.Piktochart
Piktochart serves effectively for making infographics, reports and presentations. It allows users to change blog articles into visually appealing content using its drag and drop interface and data visualization capabilities.
Piktochart has numerous templates available under marketing, education, and business. Users can incorporate interactive components like charts and maps and set fonts, colors, and layouts which are additional features.
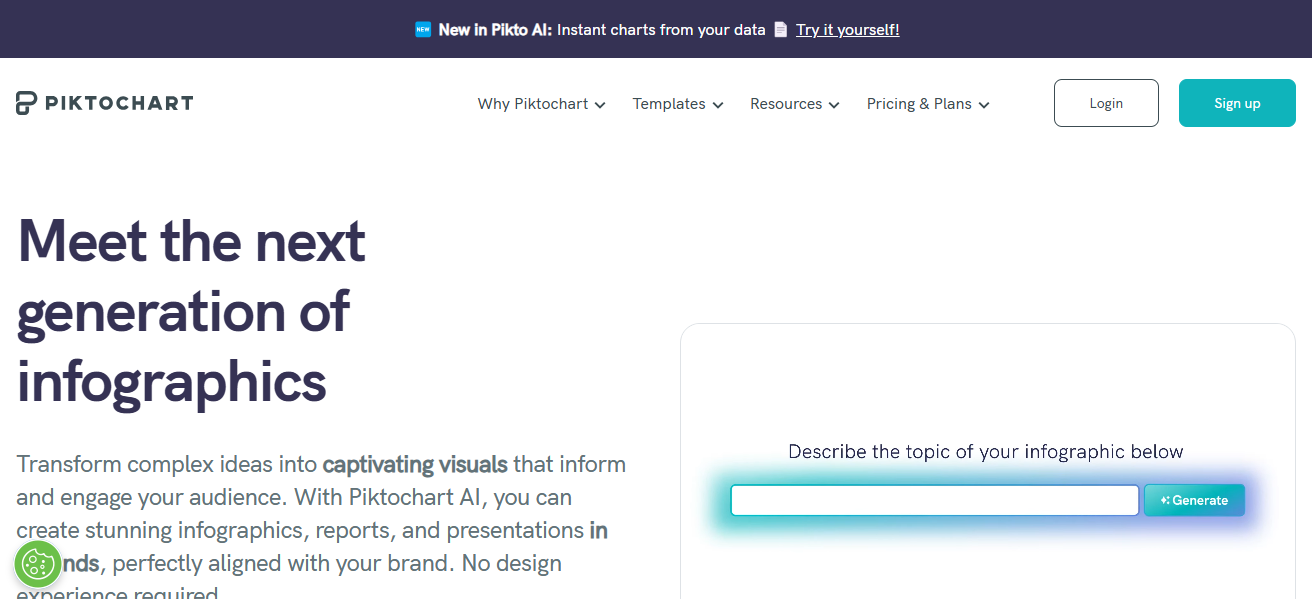
It is particularly helpful for blogs with a lot of data like in the case of statistics and comparisons. Users can opt for the free tier, but paying users are offered advanced customization and export options. Piktochart is perfect for users who appreciate precision and professionalism in visual design.
| Feature | Description |
|---|---|
| Infographic-Specific Templates | Focused library of templates for data storytelling |
| Chart & Graph Integration | Create and customize various data visualizations |
| Team Collaboration | Share, edit, and manage designs with your team |
| Presentation Mode | Turn infographics into slides or reports |
| Real-Time Data Sync | Import and update charts with live data |
| Intuitive Interface | Designed for ease, even for beginners |
3.Visme
Visme assists in transforming blog entries into awesomely animated and interactive infographics. It has hundreds of templates and a massive library of icons, images, and data widgets.
If you blog, Visme is fantastic if you want to quote someone, display data, or present a guide in a visual step-by-step format. It is very easy to create branded infographics, animated objects, and embed videos.
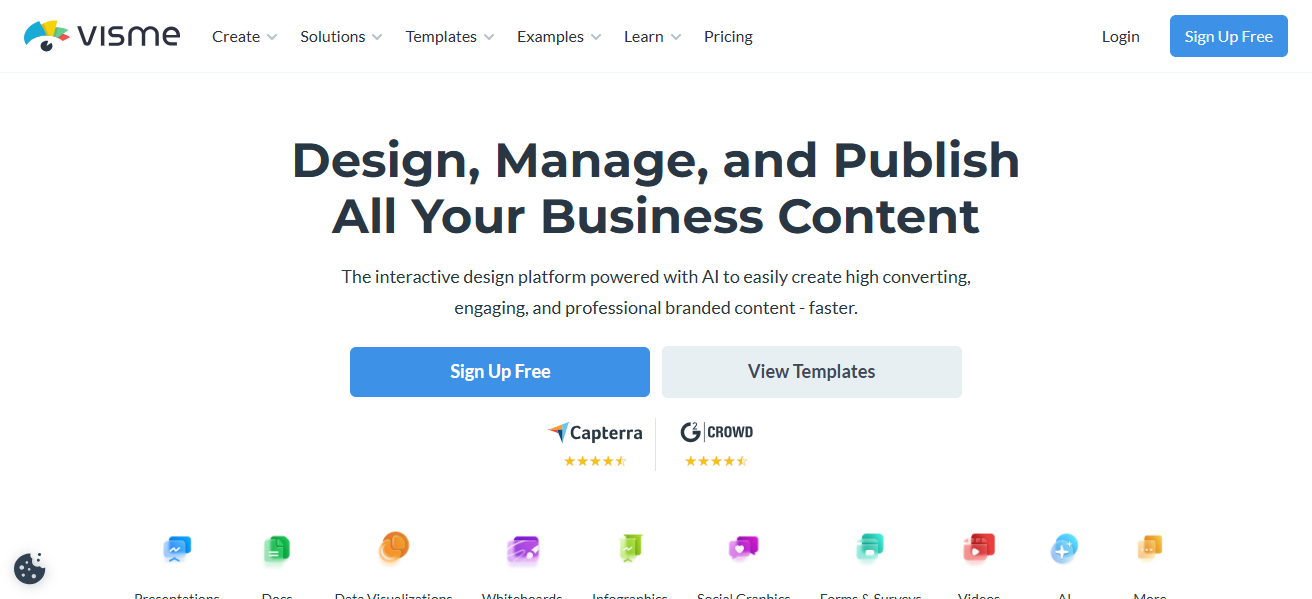
You can also track engagement with its analytics feature. Visme is great for everyone, offering free and premium plans. It marries beauty with functionality, making it a must try for every content creator.
| Feature | Description |
|---|---|
| Interactive Elements | Add pop-ups, links, and hover effects |
| Animation Support | Animate charts, text, and objects easily |
| Analytics Integration | Track views and engagement on published designs |
| Brand Management | Lock in colors, fonts, and logo usage |
| Content Blocks | Drag in pre-designed content sections for speed |
| Data Widgets | Custom graphs and visuals for statistical content |
4.Venngage
Designed with impact and ease of use in mind, Venngage helps users create infographics quickly and efficiently. With its drag-and-drop and template functionalities, bloggers and marketers are able to transform text-heavy posts into visually engaging infographics.
It also offers chart, icon, and custom branding insertion tools, hence, it is useful for individuals and companies. Through Venngage, users can illustrate processes, timelines, or even complex statistics in a visually intuitive manner, thanks to the platform’s infographic design templates and layout tools.
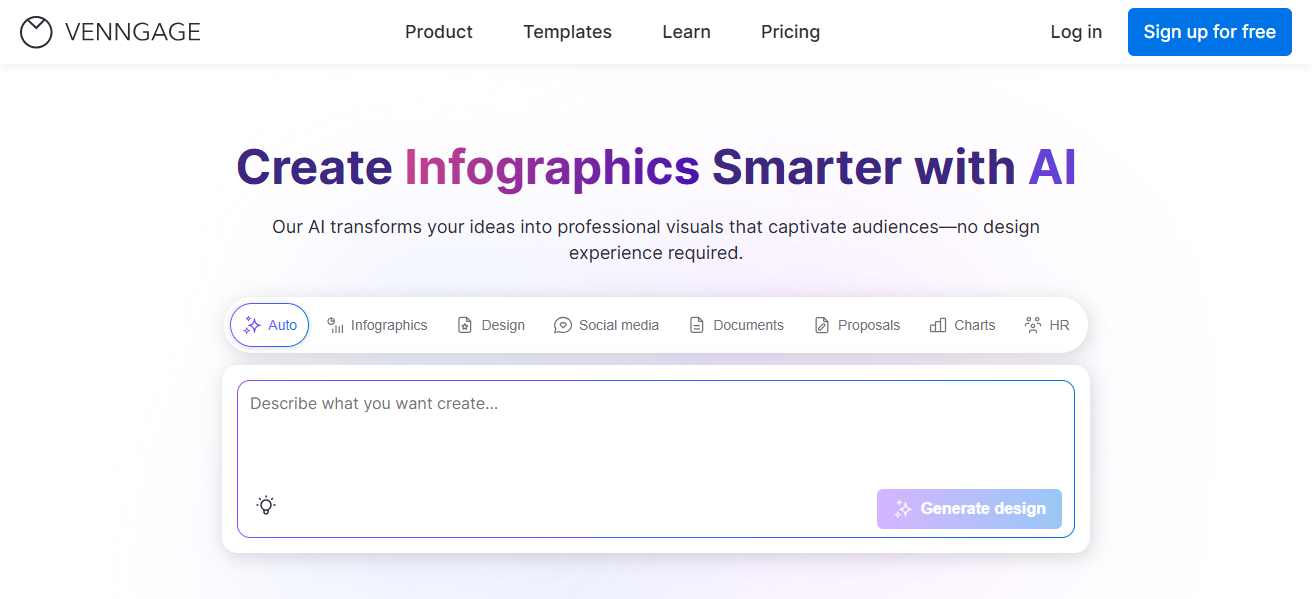
Its free version has limited functions and paid versions offer more assets and branding options. Be it an infographic or a concise visual summary of a blog post, Venngage helps to communicate information seamlessly.
| Feature | Description |
|---|---|
| Beginner-Friendly UI | Built for users with no design experience |
| Business-Centric Templates | Includes infographics for HR, marketing, finance |
| Custom Branding | Upload logos, set fonts, and color palettes |
| Team Sharing Options | Collaborate with colleagues or clients |
| Icon & Image Library | Thousands of visuals to support infographic themes |
| Export in Multiple Formats | PNG, PDF, and interactive options available |
5.Adobe Express
Adobe Express provides a simple interface compared to Adobe’s other products while still offering professional-grade design features. This allows users to turn blog entries into infographics easily.
Users can take advantage of Adobe’s extensive library of fonts, icons, and images to create infographics from scratch or use pre-made customizable templates. Users can also maintain a consistent visual identity through brand kits.
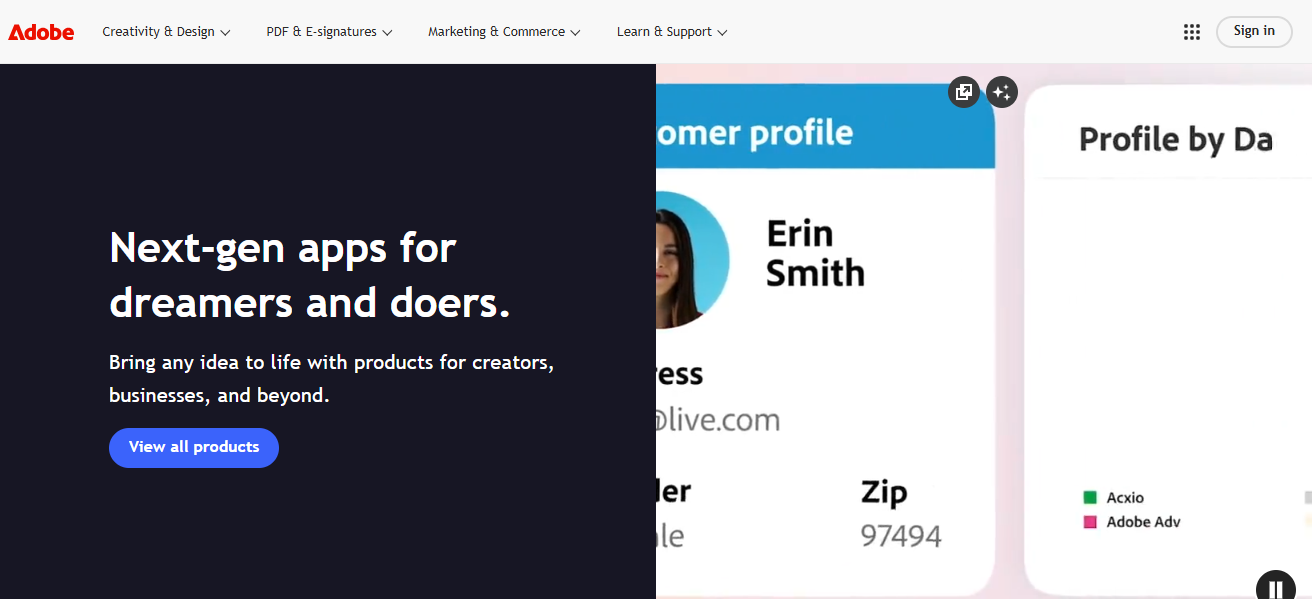
Other Adobe products can be integrated into Express which makes it a great choice for professionals, but beginners can use it just as easily. Infographics can be published online or downloaded in high-resolution format. Adobe Express is great for bloggers who want to create professional visual content with minimal effort.
| Feature | Description |
|---|---|
| Professional Templates | Sleek, modern design presets |
| Adobe Ecosystem Integration | Connects with Photoshop, Illustrator, etc. |
| One-Click Resizing | Quickly resize for different platforms (social/blog) |
| Video & Animation Tools | Basic motion graphics available |
| Font & Asset Library | Adobe Fonts and royalty-free Adobe Stock access |
| Branding Tools | Create brand templates and apply them easily |
6.Easel.ly
Easel.ly is an infographic tool which is suitable for virtually anyone as there are no requirements, and the templates available eases the bloggers work. They offer a variety of templates which the users can customize to meet their requirements.
The design is very easy. It uses a “drag and drop” system that makes adding charts, text boxes and icons very easy. Easel.ly is very good for making visual aids for timelines, processes, and summaries.
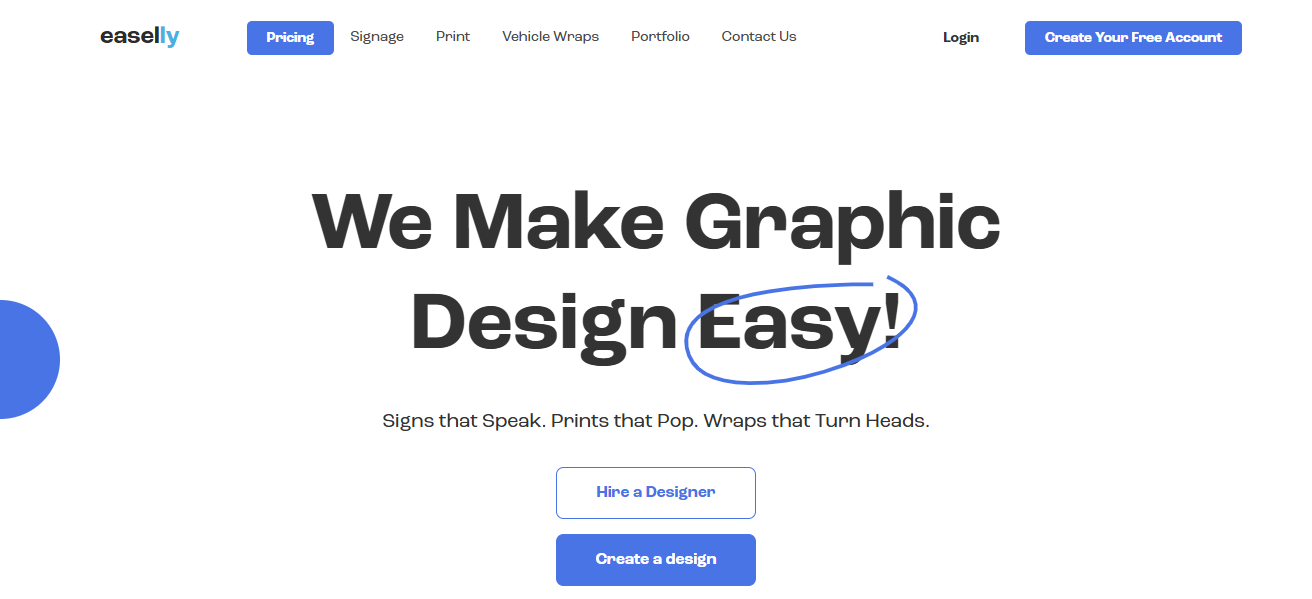
In the free version, users can access a good number of infographics, icons, and other design components, and more are available as premium features. Even though the tool is not as powerful from other infographic maker tools, the easel has a very easy to understand interface which makes it possible to learn very fast.
| Feature | Description |
|---|---|
| Ready-to-Use Infographic Themes | Simplified themes for common infographic types |
| Easy Drag-and-Drop Editing | Intuitive for non-designers |
| Free Icon & Shape Collections | Basic but useful graphic assets |
| Upload Custom Graphics | Add your own images or logos |
| Embed Functionality | Share infographics via URL or HTML embed |
| Quick Export Options | Download to JPG, PDF without complicated steps |
7.Infogram
Infogram is an infographic and data visualization design tool that is ideal for bloggers with content heavy with data. It includes a variety of tools including charts, maps, dashboards, and even graphs.
They are very useful for bloggers who deal with complex information. Infogram enables users to upload data from Excel, Google Sheets, or even from live feeds, automatically refreshing the visuals.
Infogram uses well designed templates and therefore, can guarantee infographics are responsive and mobile friendly. They offer a free plan, but advanced features like branding, analytics, or even export options are available on a paid subscription. Bloggers who want to integrate data and tell stories will find this tool very useful for their blogs.
| Feature | Description |
|---|---|
| Advanced Chart Builder | 35+ interactive chart types |
| Live Data Integration | Import data from Excel, Google Sheets, etc. |
| Map Visualization | Create interactive maps for blog geodata |
| Drag-and-Drop Widgets | Easily position visuals and text blocks |
| Embed & Sharing Options | Publish directly to web or embed in blog posts |
| Responsive Design | Infographics adjust across all devices |
8.Snappa
Snappa is a fast and useful tool every Blogger can use to create infographics without using a lot of time and without much technical know-how.
It balances ease of use and efficiency, providing preset dimensions and templates to ensure Snappa users can distill blog posts into infographics quickly and easily.
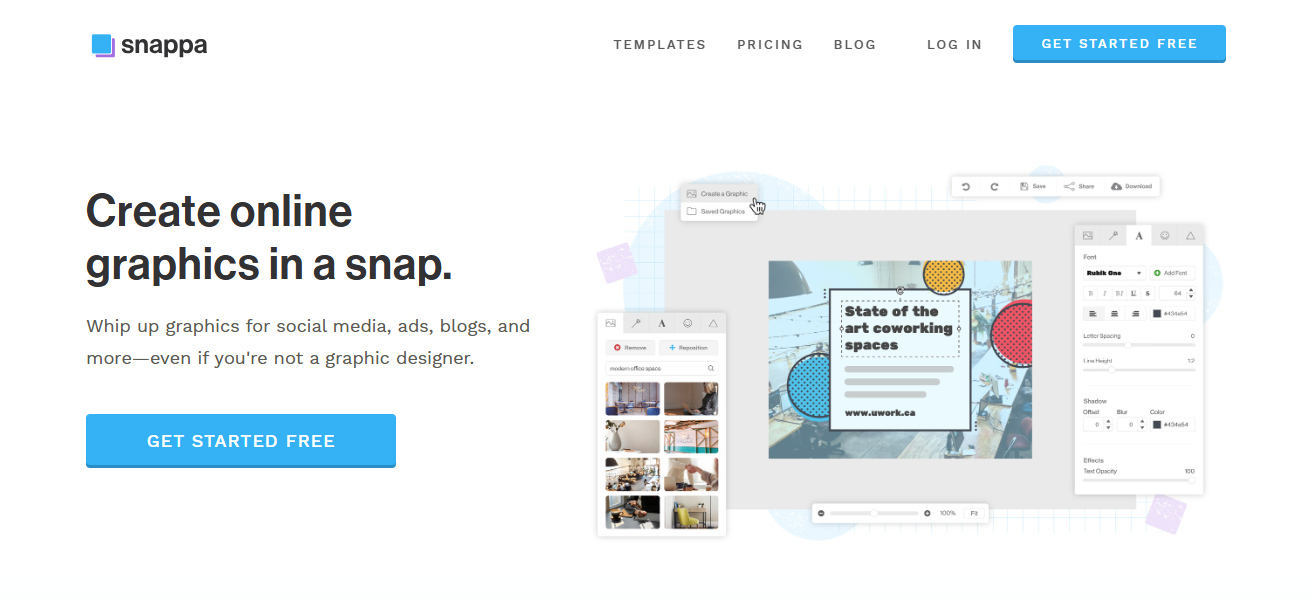
Snappa is not only easy to use but is also very helpful in content creation. It has a huge stock photo, icon and font library which makes design creation appealing. It is also easy to use for social media where you can create blog-to-infographic designs that work across many different social media sites.
The free version has limited downloads while team collaboration and branded designs are paid options. Snappa is primarily focused on content creators which makes it more appealing for social marketers.
| Feature | Description |
|---|---|
| Infographic-Sized Templates | Auto-set dimensions for infographic design |
| One-Click Social Sharing | Share directly to Facebook, X, LinkedIn, etc. |
| Stock Image Integration | Includes free, high-res image access |
| Custom Font Upload | Use your own fonts for brand consistency |
| Speed-Focused Workflow | Design in minutes with minimal clicks |
| Team Collaboration | Add team members for shared projects (Pro plan) |
9.Animaker
Animaker helps bloggers turn their posts into animated infographic videos and stories, allowing them to convert static and boring content into animated marvels.
You can create professional videos without any designing experience using Animaker because of its vast animation library and drag-and-drop interface.
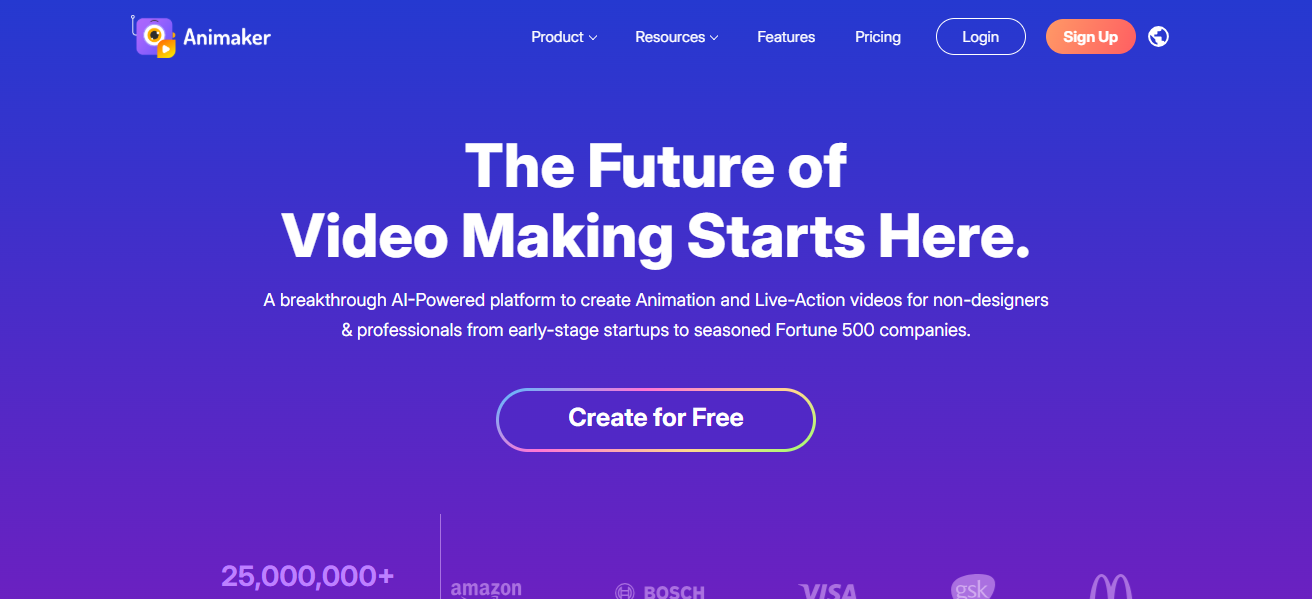
Animaker works with blog posts and tutorials and even offers animations for characters and scenes, voiceovers, and transitions. It is an excellent tool for increasing engagement by turning static content into something dynamic and shareable.
Bloggers looking to spice up their content will find Animaker’s static tools quite powerful, even if it does take some time to learn. They offer premium and free tiers.
| Feature | Description |
|---|---|
| Animated Infographics | Convert blogs into motion-based visuals |
| Character Library | Use animated characters for storytelling |
| Voiceover Support | Add narration to videos easily |
| Timeline Editor | Manage scene transitions and timing |
| Social Media Export Sizes | Auto-optimize for YouTube, IG, Facebook |
| Free Templates | Library of animation-ready infographic layouts |
10.Mind the Graph
Mind the Graph focuses on scientific and academic infographics. It caters to bloggers in the health, science, and education niches. It provides templates and illustrations for infographics, which helps in the visual depiction of complicated research or technical information.
It is designed for non-designers, with scientific icons and illustrations, together with drag-and-drop features. Users can publish their infographics directly or export them in high-quality formats.
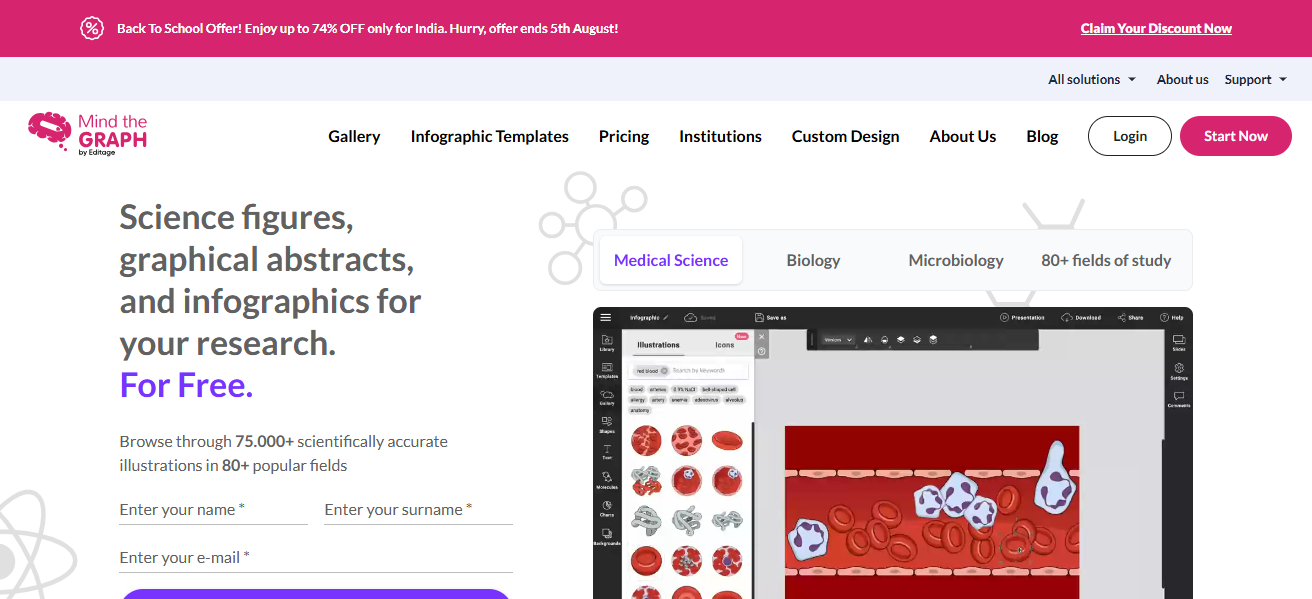
It may be more niche-focused, but its strength is accuracy and precision when delivering data-driven content. Mind the Graph is more suitable for created illustrated infographics for scholarly blog posts.
| Feature | Description |
|---|---|
| Scientific Icons Library | Thousands of science/medical illustrations |
| Drag-and-Drop Builder | Simplifies infographic creation for researchers |
| Pre-Formatted Layouts | Templates tailored for scientific communication |
| Export for Journals & Slides | High-res images for publications and talks |
| Academic Font Options | Styles designed for research audiences |
| Collaboration with Researchers | Invite peers to review and edit your visuals |
Conclusion
To sum up, converting blogs to infographics increases user engagement, improves understanding, and makes sharing easier.
Users can find appealing visuals on Canva, Piktochart, and Visme, while more specialized needs can be served by Animaker and Mind the Graph.
These sites optimize the experience for both experts and novices, allowing effortless content transformation into compelling visual narratives.