In this article, I will examine some of the Best Crypto On-Chain Metrics To Observe, analyzing on-chain tools to study different cryptocurrency networks.
- Key Points & Best Crypto On-Chain Metrics To Watch
- 10 Best Crypto On-Chain Metrics To Watch In 2025
- 1. Active Addresses
- 2. Transaction Volume
- 3. Hash Rate
- 4. Exchange Inflows/Outflows
- 5. Wallet Distribution
- 6. Network Value to Transactions (NVT)
- 7. Supply Held by Long-Term Holders
- 8. Realized Cap
- 9. MVRV Ratio
- 10. Staking Ratio
- Cocnlsuion
- FAQ
On the active addresses and transaction volume to the hash rate and staking ratios, these varied metrics indicate how ‘healthy’ a network is, how active users are, and how the market is trending.
Ultimately, mastering these tools will help potential investors understand what is really happening in the market, discerning true demand and adoption from mere speculation.
Key Points & Best Crypto On-Chain Metrics To Watch
| On-Chain Metric | Key Insight / Importance |
|---|---|
| Active Addresses | Measures user engagement and network activity; rising numbers suggest growing adoption. |
| Transaction Volume | Indicates overall usage and economic activity on the blockchain. |
| Hash Rate | Reflects network security and miner confidence (especially for proof-of-work chains). |
| Exchange Inflows/Outflows | Tracks crypto moving to/from exchanges; inflows may signal selling pressure. |
| Wallet Distribution | Reveals how wealth is spread across holders; helps spot whale accumulation. |
| Network Value to Transactions (NVT) | Valuation metric comparing market cap to transaction volume. |
| Supply Held by Long-Term Holders | Shows conviction and potential price stability. |
| Realized Cap | Measures value based on actual transaction prices, not market price. |
| MVRV Ratio | Compares market value to realized value; helps identify overbought/oversold zones. |
| Staking Ratio | Indicates how much of a token supply is staked; higher ratios suggest long-term confidence. |
10 Best Crypto On-Chain Metrics To Watch In 2025
1. Active Addresses
Active addresses show the number of distinct wallets that engage with the blockchain in a particular time frame, which can involve either sending or receiving tokens.
This metric helps to show the adoption of the network and the engagement of users. An increasing amount of active addresses can suggest greater interest and usage, potentially indicating positive sentiment.

On the contrary, a lack of activity can suggest an adoption drop or positive sentiment decrease. Users primarily track this for the network’s hype level and possible price changes. Examining this metric over time uncovers behavioral patterns and network momentum.
2. Transaction Volume
The volume of transactions on a blockchain over a period represents the quantity or value of the transactions. It demonstrates the overall economic activity of the network and whether a cryptocurrency is being utilized for payments, trading and transfers.
High transaction volume suggests active utility and demand, while low transaction volume might indicate a lack of activity.

Stagnation. Analysts consider on-chain volume and the volume trends relative to market capitalization to determine whether the price movements align with real usage.
In addition, sudden spikes or drops might reflect speculation and shifts in the overall network investor sentiment.
3. Hash Rate
All the computing power utilized in protecting a proof-of-work blockchain is termed as hash rate. There is increased network security and protection against attacks like double-spending with an increased hash rate.
An increase in hash rate is usually a reflection of increased confidence by miners as more and more resources are committed for transaction validation. However, a decline in hash rate might indicate miners capitulating to the network.
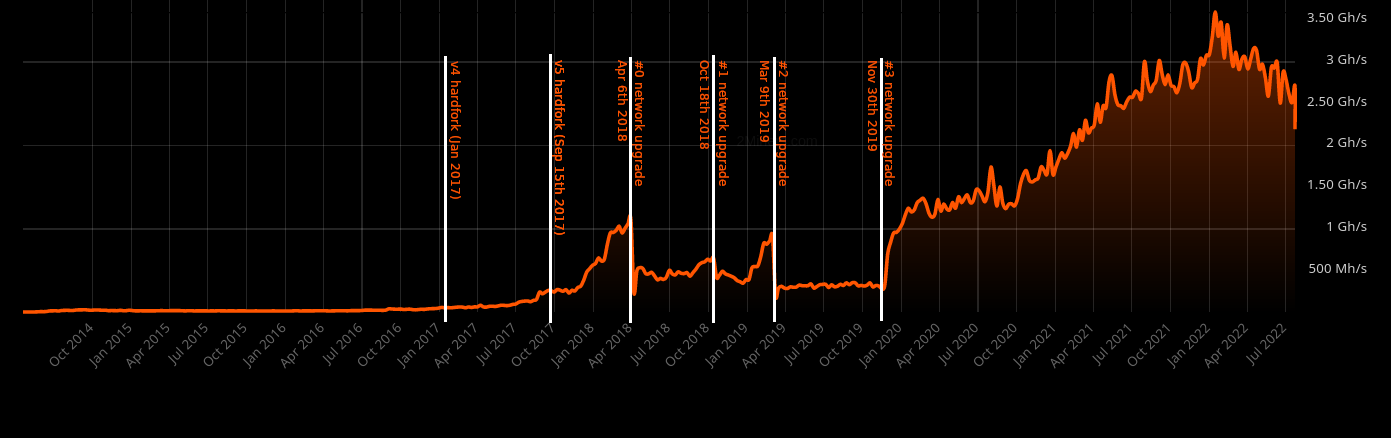
They might do this due to a range of factors like profitability and regulatory pressure. Being able to predict trends in hash rate can determine the long-term security of a blockchain.
An increase in confidence in the network might also help market sentiment and price stability during periods of high volatility.
4. Exchange Inflows/Outflows
These metrics look at the volume of assets being added to and removed from cryptocurrency exchanges. If there is a large inflow of assets, this often indicates a sell-off, as users deposit assets in order to trade and subsequently withdraw cash.
On the other hand, sizeable outflows mean that the assets are likely being long-term held or accumulated, which reduces the amount of assets available on the exchanges.
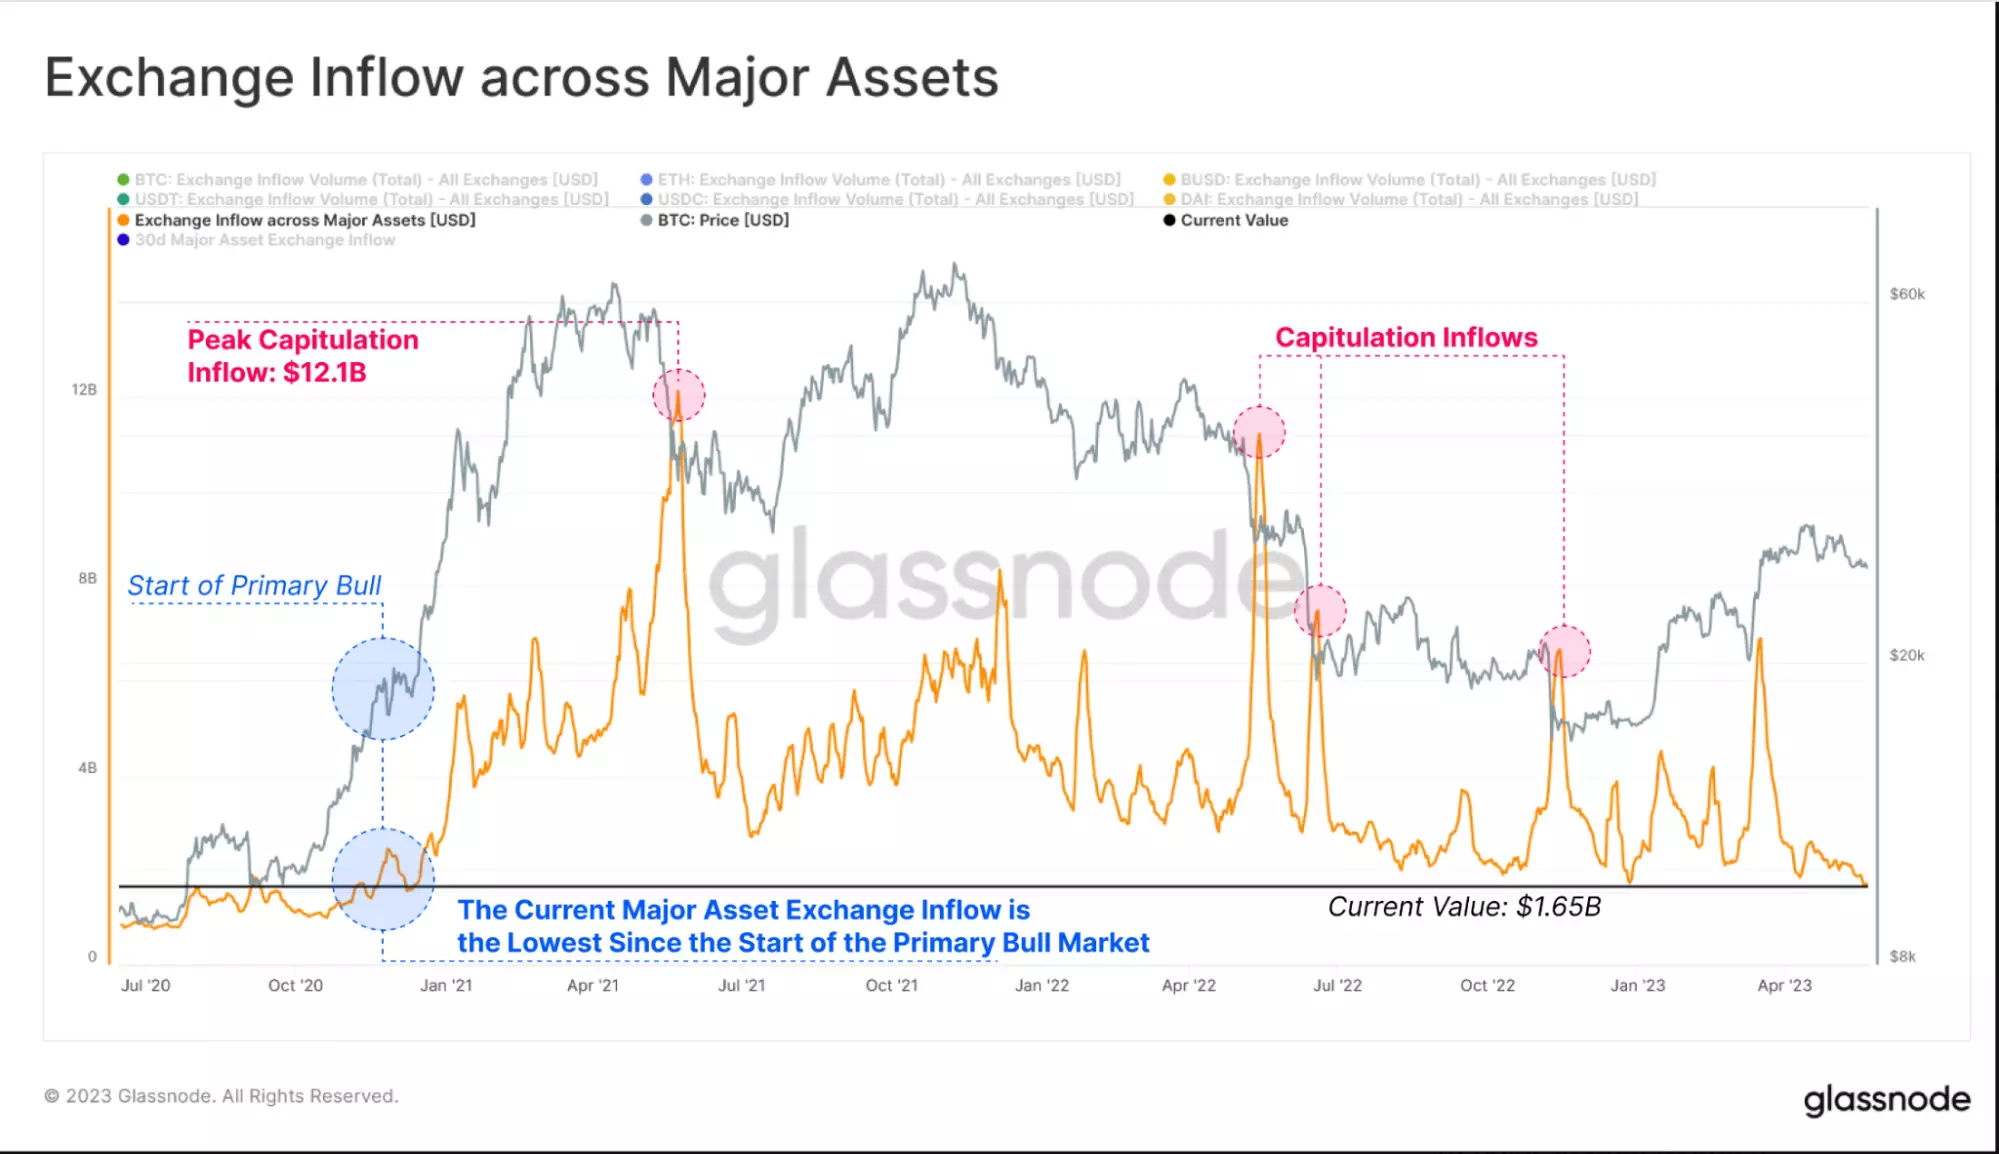
This is likely to create bearish conditions in the short-term. This is often a good market sentiment predictor and inflow-outflow balance is a good indicator (less volatile) of outflow
targeting and long-term position consolidation. This provides insights into the market which is not clearly visible on the price trends.
5. Wallet Distribution
Wallet distribution analyses how the balance of a cryptocurrency or other blockchain-based asset is held and the concentration, or lack there of, in distribution, to, or from, holders.
If a network has only a few wallets that contain the majority of the asset, the network is likely to suffer price and volume ‘pump and dump’ cycles.
On the other hand, wider distribution is a signal that the asset and network have a healthier structure.

This is referred to as the ‘balance of the ecosystem’ or ‘volatility of the funds’. Centralized assets strategically increase abuse liquidity
that skews the price only to reveal the true result of the price. This is critical to understand the likely price changes, net-work strength and resilience.
6. Network Value to Transactions (NVT)
The NVT ratio is a measure of cryptocurrencies’ market capitalization and transaction volume, and can be conceptually described as a “P/E ratio” for networks.
Higher NVTs signify a network’s overvaluation, and lower NVTs signify undervaluation. Analysts assess whether on-chain activity warrants price movements using NVT.

Sudden increases may indicate speculative behavior, while long periods of low NVTs indicate stronger fundamentals.
NVT is a powerful tool for long-term NVT to price speculation. Coupled with other metrics, NVT provides useful information to help discern hype-induced network increases from true network adoption.
7. Supply Held by Long-Term Holders
This metric examines the percentage of tokens that have not been transferred or sold for a long time. It is a measure of confidence for the network.
Long-term holders of a network contribute to price stability by reducing the likelihood of a sell-off. On the other hand, a decline in long-term holders could indicate a loss of confidence in the network.
Moves on this supply are of great interest to analysts as it reflects market sentiment, determining whether the network is in the phase of accumulation or liquidation.

Investors can understand a network’s price stability in a downturn, as well as consolidation and accumulation phases, by studying the supply and price trends of long-term holders.
8. Realized Cap
In contrast to market cap, which values a network based on current market price, realized cap estimates network value according to the most recent price at which each token was exchanged. This creates a more accurate picture of investors’ market valuation and cost basis.
Realized cap, by measuring inactive supply, provides a more accurate picture for long-term trend analysis instead of market cap.

It is common for investors to analyze the disparity between market cap and realized cap to determine the level of valuation for a cryptocurrency.
It can indicate correction or accumulation potential, offering a more holistic view of the network’s long-term sustainability and fundamental price guidance.
9. MVRV Ratio
The MVRV Ratio relates the Market Value and Realized Value of a cryptocurrency, revealing a crypto asset’s worth and value, market fluctuations, and the periods when it is over and under valued, cost basis of the investors, elucidating periods when it is over and under valued.
Overly high MVRV values indicate when market tops are reached and potential profits can be cashed out and low valued MVRV values means potential buying opportunities.

Traders also use this indicator to estimate value corrections and default trends. The investors’ behavioral patterns, the crypto asset’s history and the economic behavior patterns are to help analysts understand the crypto assets’ history and market cycles to make long term market strategies.
10. Staking Ratio
The staking ratio shows the extent to which tokens are staked relative to the entire circulating supply. A high staking ratio signifies strong participation, investor confidence, and participation as well as circulation supply that can help the price appreciate.
Low staking ratios, on the other hand, can mean that users prefer liquid assets, the staking rewards are too low or there is poor confidence in the network.

Analysts use this ratio to gauge network engagement and security, as well as the likelihood demand will be driven by staking rewards.
The incentive or disincentive sentiment anticipated in the market idle will reflect in staking. For proof-of-stake networks, the staking ratio is also an important measure of consensus and validator participation, which influences the long-term stability of the network.
Cocnlsuion
To conclude, assessing metrics such as active addresses, transaction volume, hash rate, and NVT ratio gives an understanding on the health, adoption and the market behavior of a cryptocurrency.
These metrics provide the investors the ability to tell the difference between hype and real usage, forecast patterns, and determine appropriate actions.
Monitoring the long-term holder distribution, staking and network fees further assesses the network’s stability and growth potential.
FAQ
On-chain metrics are data points derived directly from a blockchain that help analyze network activity, health, and investor behavior.
They indicate user engagement and adoption; more active addresses often signal a healthy, growing network.
It reflects the economic activity on a blockchain, helping gauge real-world usage and demand.
Hash rate measures network security; higher hash rates imply a more secure blockchain against attacks.
They track tokens moving to/from exchanges, signaling potential selling or accumulation trends.