In this article, I will discuss what blockchain power visualization is and why it has become an essential tool in understanding digital ledger systems.
Blockchain generates massive amounts of complex data, and visualization helps convert that information into clear, meaningful graphics.
This makes it easier for users, traders, and businesses to interpret blockchain activities effectively.
Overview
As we advance in blockchain technology, vast amounts of data are generated with every second. Within the blockchain ecosystem, there exists a plethora of intricate activities such as transactions, wallet movements, smart contracts, and decentralized applications (dApps). All of these activities can be quite complex and difficult to understand.
This is where the term blockchain power visualization becomes useful. It refers to the process of converting raw blockchain data into interactive and visually engaging graphics. This enables both experts and novices to comprehend the true potential of blockchain networks and the “power” they hold.
Understanding the Concept
Transaction data is stored in a decentralized ledger across multiple computers, which is known as blockchain.
While conducting a blockchain, the whole activity is visible to the users within the system. Because the underlying data is presented in the form of cryptographic strings, blocks, and timestamps, a lot of users get overwhelmed.
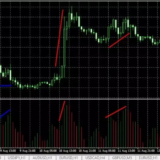
There are a number of visualization tools which are designed to help overcome this problem. Power Visualization, as one of them, uses complex algorithms to convert numbers and codes into patterns, charts, maps, and even dashboards.

Visualization tools allow one to view transactions based on activity, wallet use, block size, and other pertinent factors.
This specialized technology saves an incredible amount of time analyzing numerous transaction logs while also offering insight into potential advantages, risks, or trends related to the blockchain.
The Importance of Visualization In The Blockchain
The financial, supply chain, healthcare, and gaming industries are rapidly adopting blockchain technology, yet its interpretability remains the most prominent obstacle. Encryption conceals an overwhelming amount of data. Visualization helps enhance understanding through the following:
Visualizing Network Activity: Users are provided an intuitive interface that displays the number of transactions completed, the key players involved, and the addresses that hold a considerable portion of the network.
Identifying Whale Activity: Visualization allows the instant observation of large wallet transfers due to its impact on the market, ensuring that the user remains informed.
Oversight of Smart Contracts: Users can observe the execution of contracts thereby understanding which dApps are popular alongside the direction in which funds are flowing.
Fortifying Security: Fraudulent, hack, or scam activities can trigger visual dashboards that provide alerts due to the abnormal patterns being detected increasing the chances of detection.
Improving Decision-Making: Based on data provided, investors and business entities are now able to make informed decisions on transactions, business collaborations, and whether to adopt blockchain technology.
Key Features of Blockchain Power Visualization
Blockchain visualization tools often include advanced features, some of which are more powerful than simple graphs. Here are some of the most powerful features:
- Interactive Dashboards: Data that is updated in real-time can be filtered, zoomed in and out, and customized to suit the user’s needs.
- Transaction Mapping: Following the transaction of funds from one wallet address to another to trace the movement of funds.
- Heatmaps: Indicating which tokens or networks are most active at any given time.
- Cross-Chain Insights: Analyzing and comparing the activity and performance of blockchains like Bitcoin, Ethereum, and Solana.
- AI-Powered Analytics: Artificial intelligence can now be integrated to forecast changes in the market and detect irregularities.
These tools are beneficial to not only the traders, but also the regulators, researchers, and blockchain technology businesses and industries with interest in its applications.
Real-World Applications

Crypto Trading Platforms: Many exchanges utilize visualizations enabling traders to monitor price, liquidity, and order book depth in real-time.
Compliance and Regulation: Visualization tools are also employed by governments and agencies to detect and monitor anomalous wallet activities to curb money laundering.
Supply chain transparency – Stakeholders can now leverage blockchain to track and trace products’ entire life cycles from their genesis to the ultimate destination, with the aid of interpretative visualization tools.
Scholarship – Professors and blockchain institutes use visualization tools to study the metrics and analytics of transaction volumes, the blockchain adoption rate, and overall network efficiency.
The Prospective blockchain visualization should
The further adoption of blockchain technology will trigger the development of more sophisticated visualization tools.
These tools will reflect the power of artificial intelligence, machine learning, and advanced data analytics, allowing them to visualize not only the actual events but also anticipate future developments.
Moreover, with Web3 and the Metaverse emerging, data from the blockchain will be represented not only on dashboards but also through immersive three-dimensional visuals. Picture a virtual environment
Where blockchain transactions illuminate streams of light and wallet interactions emerge as complex networks of dynamic geometry. Transformative visualization on this scale will enable a paradigm shift in the perception and interaction with blockchain technology.
Conclusion
The case study illustrates that the process of creating powerful blockchain visualizations goes a step further than simple graphical representation of numbers. It also attempts to make the data on blockchain accessible, understandable, and actionable.
Whether it is an investor looking for a market signal, or a regulator trying to ensure safety, visualization is the middle ground that allows a meaningful reinterpretation of the raw blockchain data.
It is clear that as the technology progresses, effectively blockchain will be able to be visualized, and therefore, truly liberate the potential it offers, confidently and clearly empowering individuals and businesses.
FAQ
Traders, businesses, regulators, researchers, and developers use it to track transactions, detect risks, and make informed decisions.
It improves clarity, detects unusual activities, tracks whale movements, and supports better decision-making.
It will use AI, machine learning, and 3D tools to provide predictive insights and immersive Web3 experiences.