Chainlink Price Prediction: LINK Reaches 8-Month High
On September 7, 2026, Chainlink (LINK) hit $13.64, a price not seen since January 18, 2026. Given the nature of the way this price change happened, market participants are attributing its recent increase to higher market activity, increased adoption of the network and activity surrounding derivative products. High demand among futures traders is evidenced by the $784 million in open interest that LINK has generated, according to CoinGlass.
LINK Price Surges 94% with Increasing Network Demand
In the last few months, Chainlink (LINK) has made a strong recovery, with an aggressive 94% rally between June 22 and September 7. This is occurring concurrently to an expansion of the Chainlink blockchain’s Network in DeFi and other finance applications.
“CONTRAX” analyst Chris Barret points out that Chainlink has been a key player in facilitating approximately $34 trillion in transactions.
This is further illustrated by the analytics platform DeFiLlama, which shows Chainlink’s DeFi Total Value Secured (TVS) at $40.02 billion, up $6.04 billion from $33.98 billion on August 7. Chainlink had also partnered with the United States Commerce Department in order to bring economic data such as GDP, inflation and sales, onto the blockchain.
Though this recent rally has been strong, Chainlink’s LINK is still down significantly from its $52.88 all-time high it reached in May 2021, leaving lots of room for more upside potential.
Increased LINK Derivatives Activity
The derivatives market saw increased interest, as well. Wedbush brokerage has attributed the surge to the $784 million open interest on LINK, the highest since October 2025.
LINK saw $1.04 billion in derivative trading volume this week, up by 8%.
Whale activity has a contradicting signal. Coinbase received a reported approximately $26 million worth of LINK, totaling 2.41 million LINK. Transfers like these can represent profit taking or selling.
Analyst Axel’s projection potentially shows a bullish trend from LINK’s current price. Link needs to close the week above $13.50 resistance before the projection can potentially be valid. If it can do that, it may help strengthen the bullish trend further.
Looking into something else, LINK ETFs dominated the month of August with $18.27 million in inflows. Unfortunately, LINK ETFs had no inflows in September, along with Ethereum and Bitcoin dominating the inflows at $218 million and $986 million.
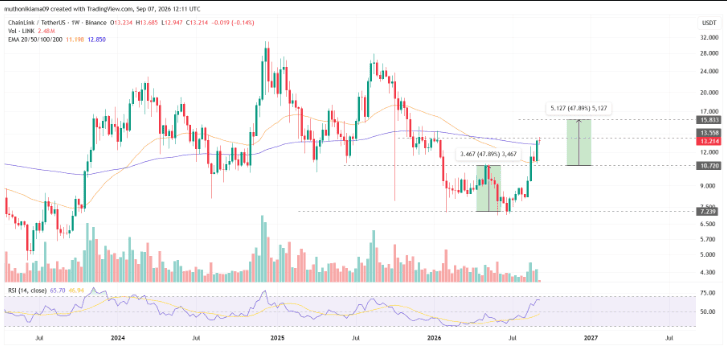
The weekly chart is showing LINK breaking its $10.72 resistance and forming a double-bottom pattern that could be the transition from a bearish to bullish trend. Adding to the pattern break, LINK also broke above its $12.85 200-week EMA further pointing to strong bullish trend potential. The RSI hovering around 65 also shows a healthy buying trend.
Looking at these trends, Chainlink could have the potential to reach its targets of $15.83 in the near future.
If LINK is able to maintain support above the $12.85 200-week EMA and breaks above $13.50, the following technical target could be $15.83. A break beyond this level could give a chance to a better possibility of an extended run to the resistance zone of $22.
However, if the 200-week EMA loses support, we could see a bearish invalidation and a likely fall toward the $10 zone.